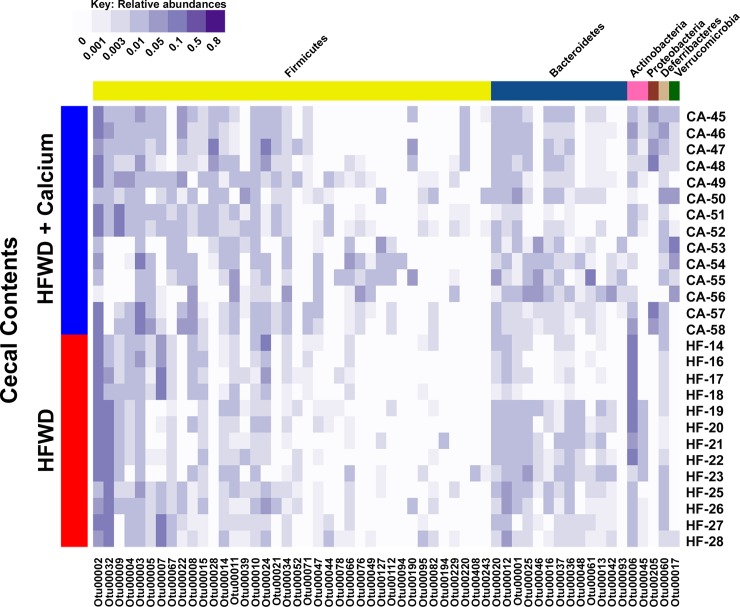
Fig 5. Microbial community composition within dietary groups.
Cecal bacterial community compositions of individual samples. Each row represents the cecal bacterial community of one sample based on relative abundances of OTUs (97% sequence similarity) identified from V4 region sequences of 16S rRNA genes. Each column represents one OTU with darker shades of purple indicating higher relative abundances. OTUs were organized by taxonomic classification and only the OTUs that comprised at least 2% of one sample were included.

