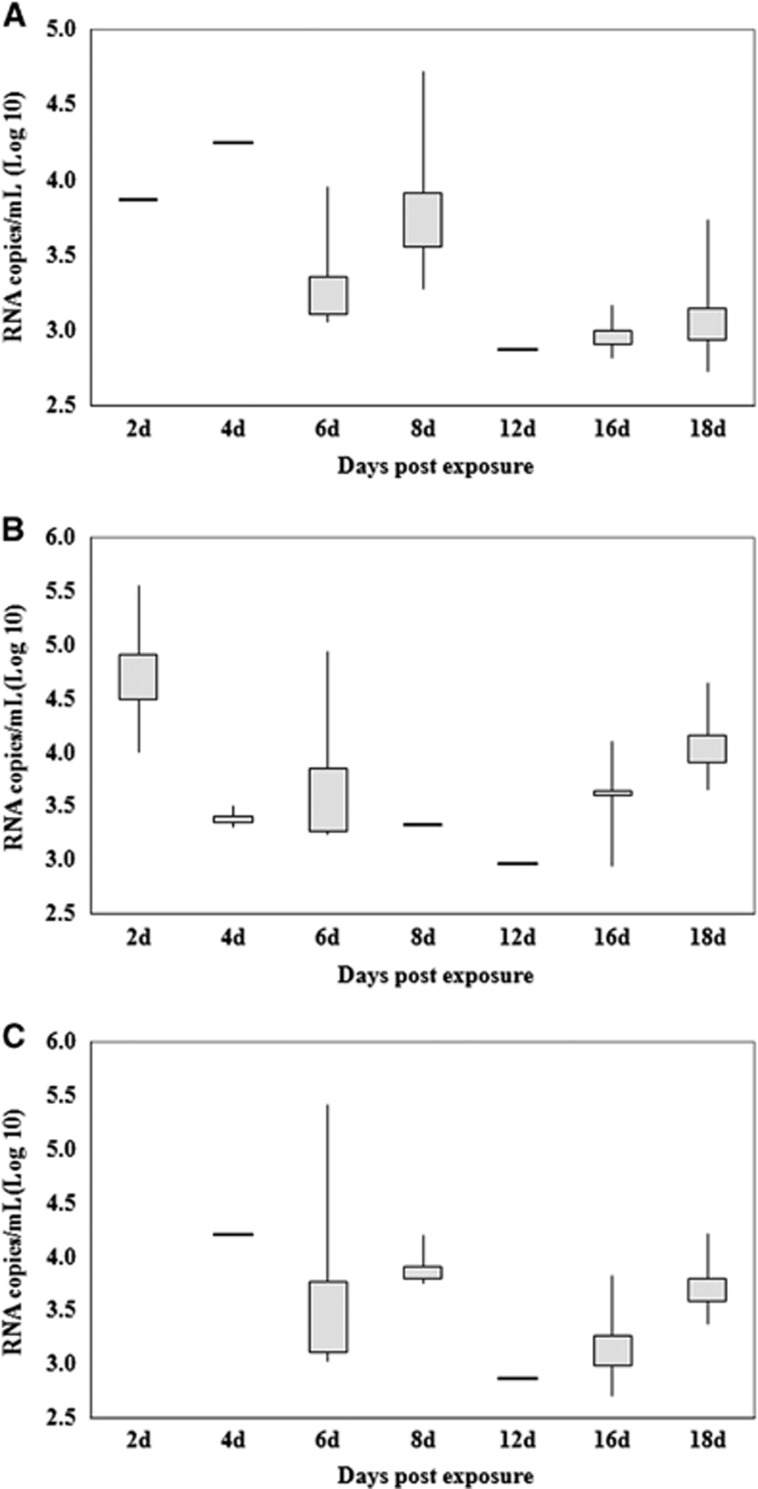
Figure 2.
Quantification of Zika viral RNA copies by real-time RT-PCR detected in the salivary glands (A), midguts (B) and ovaries (C) at different days postexposure. Each box represents the median (horizontal bar), the interquartile range (box) and the full range (‘whiskers'). RT-PCR, reverse transcription-PCR.

