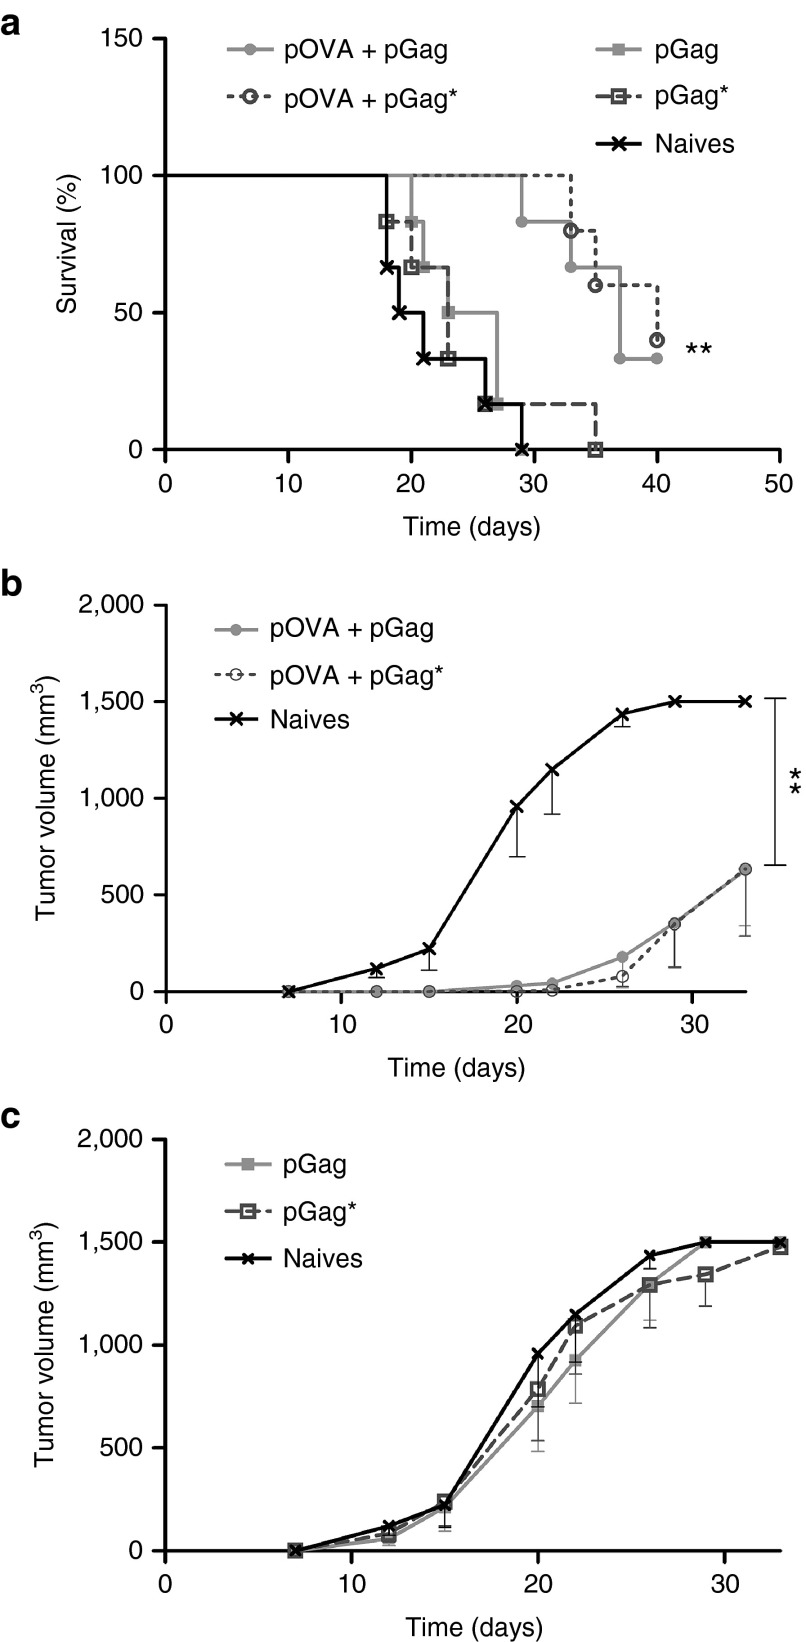
Figure 8.
Comparison of the effect of pGag and pGag* during prophylactic anti-ovalbumin (OVA) immunization on the antitumor activity. (a) Survival rate monitoring after challenge. The asterisks indicate significant differences compared with naive mice (**P < 0.01) (comparison of survival curves, Mantel–Cox test). (b,c) Tumor growth follow-up after challenge in mice immunized respectively with pOVA combined with pGag or pGag* and mice immunized with pGag or pGag* alone. The results are expressed as mean − SEM (n = 6). The asterisks show significant differences between groups (**P < 0.01) (analysis of variance, Dunnett's post-hoc test).

