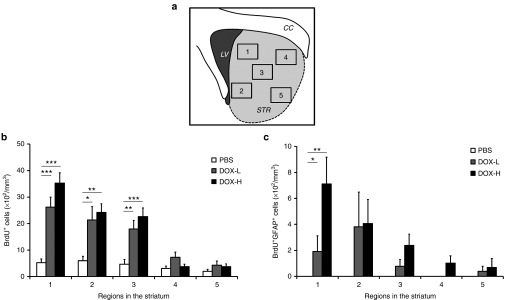
Figure 4.
Regional density of BrdU+ and BrdU+GFAP+ cells in the striatum. (a) The striatum was divided into five regions and each region was subjected to analysis. (b,c) Regional analysis. The density of BrdU+ and BrdU+GFAP+ cells in the right striatum from mice in the DOX group showed a tendency to decrease as the distance between the lateral ventricle and analyzed regions increased. The density of BrdU+ cells was comparable between the regions in the PBS group. (b) The densities of BrdU+ cells in regions 1, 2, and 3 of the DOX-H and DOX-L groups were significantly higher than in the PBS group (n = 5/group; *P < 0.05, **P < 0.01, and ***P < 0.001, one-way analysis of variance followed by a post-hoc Bonferroni comparison). (c) The density of BrdU+GFAP+ cells in region 1 in the DOX-H and DOX-L groups were significantly higher than in the PBS group. (n = 5/group; **P < 0.01 and *P < 0.05, respectively). In panels b,c, bars, mean + SEM.

