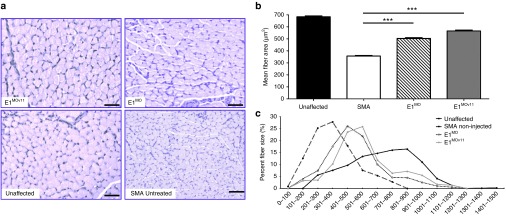
Figure 4.
Assessment of muscle pathology. (a) Representative pictures of gastrocnemius muscle cross-sections. Gastrocnemius muscles were dissected from P12 mice and cross-sections were stained with hematoxylin and eosin and analyzed by microscopy. (b) Mean fiber size was quantified using the Metamorph (Version 6.2r4) software. Data are presented as mean ± SEM. (c) Muscle fiber distribution was analyzed for each group. Both E1MO and E1MOv11 had significantly fewer small fibers and significantly higher percent of larger fibers than the SMA noninjected controls. Significance was calculated using Student's t-test, where ***denotes P ≤ 0.001. SMA, spinal muscular atrophy.

