Figure 4.
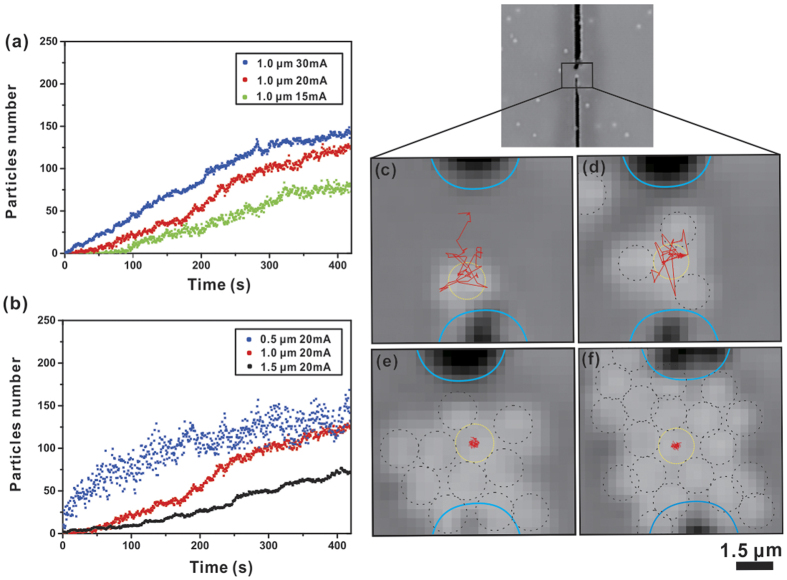
(a) Experimental time evolution of trapped particles number in different current levels. (b) Experimental time evolution of trapped particles of various sizes in same current level. Single 1.5 μm particle trajectories (shown in red line) within the METH region: (c–f) 1, 4, 11 and 20 particles are trapped at the time stamp of 33 s, 60 s, 119 s and 141 s, respectively. Time interval for the trajectory in each frame is 21 seconds. Black dashed circles indicate the trapped particles, and yellow dashed circle indicates the initial location of the trapped particle.

