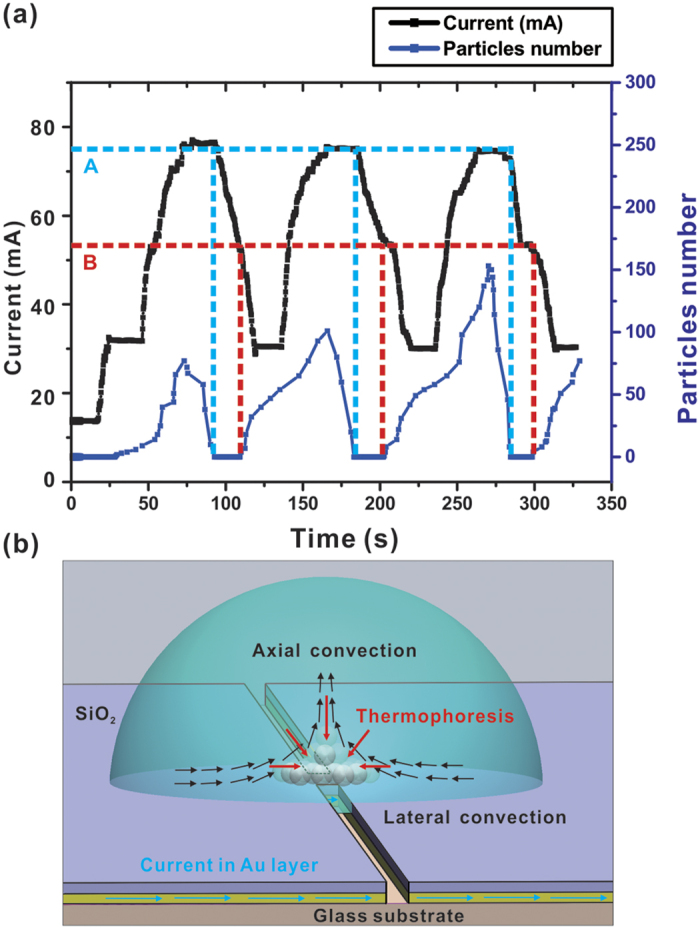
Figure 5.

(a) Number of trapped particles and applied current versus time for several periods in the “trap-push-trap” experiment. Point A: critical pushing current level; Point B: critical trapping current level. Current level was recorded by a source meter (Keithley 2612B). (b) Force components in the trapping scheme. Thermophoresis, convective force and current are represented by arrows in red, black and blue, respectively.
