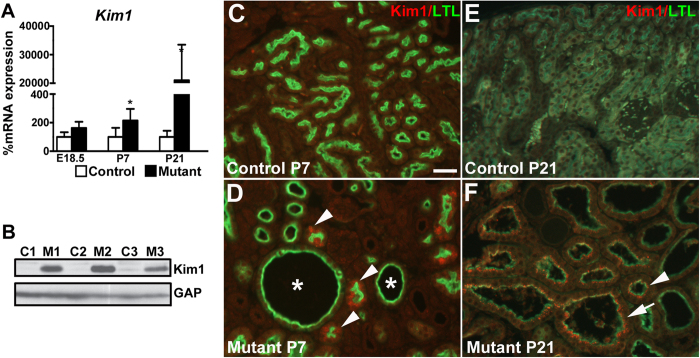
Figure 9. Kim1 is ectopically expressed initially in Six2creFrs2αKO non-dilated proximal tubular cells.
(A) Quantitative PCR analysis reveals increases in mutant kidney Kim1 mRNA expression versus controls starting at P7 and worsening at P21. (B) Western blot analysis at P21 confirms a significant increase in Kim1 protein in mutant kidneys (M1-3) versus controls (C1–3) (cropped blots are shown as indicated by the lines- these blots were run under the same experimental conditions). (C,D) Co-immunofluorescence for Kim1 (red) and LTL (green) at P7 reveals that while controls display no Kim1 expression (C), subsets of mutant non-dilated LTL-positive proximal cells ectopically express Kim1 (D, arrowheads), whereas mutant LTL-positive cysts (D, asterisks) do not. (E,F) Co-immunofluorescence for Kim1 (red) and LTL (green) at P21 again shows no obvious Kim1 expression in control kidneys (E), whereas many minimally-dilated and overtly cystic LTL-positive mutant cells ectopically express Kim1 (F, arrowhead and arrow, respectively). (A,B) scale bar = (C–F) scale bar = 25 μm.

