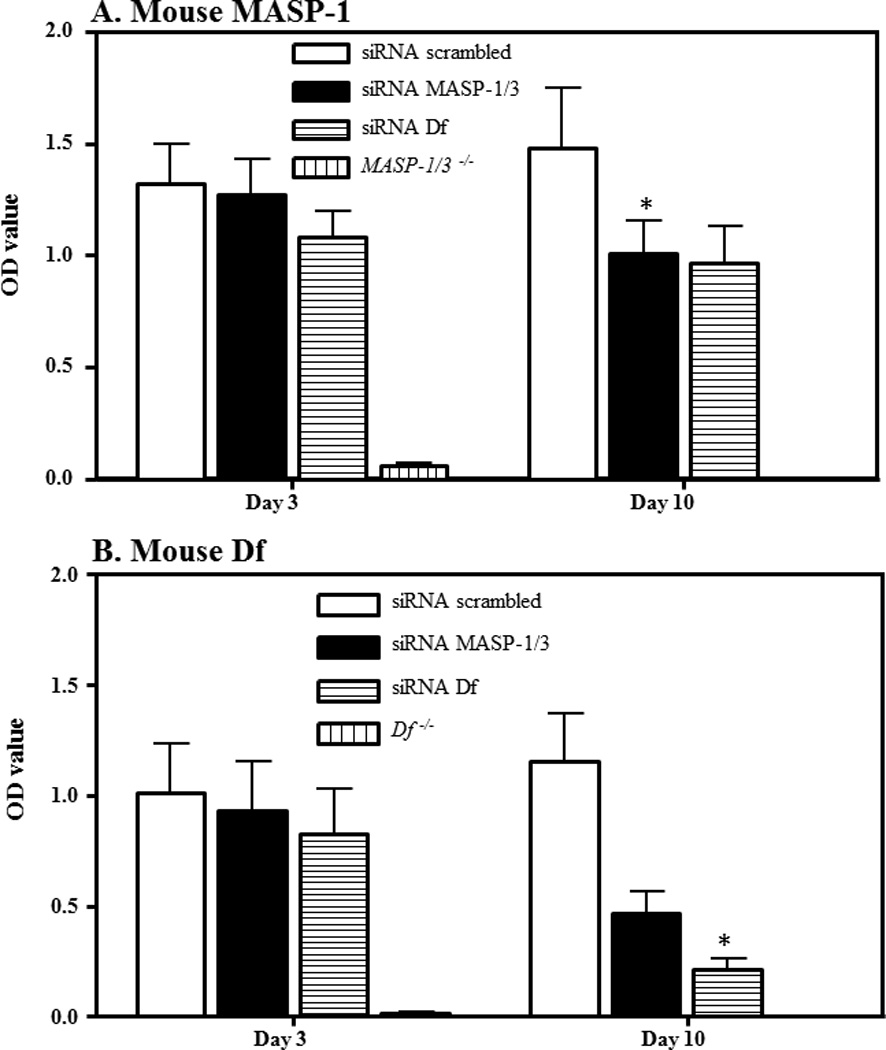
Figure 9.

Levels of MASP-1 and Df proteins in the sera from WT mice before and after the treatments and induction of CAIA. Mice were injected i.p. with scrambled siRNAs, MASP-1/3 siRNAs or Df siRNAs. ELISA were used to measure the absolute levels of MASP-1 and Df in the serum samples as mentioned in the Methods. A. Levels of MASP-1 before (day 3) and after (day 10) treatments. B. Levels of Df before (day 3) and after (day 10) treatments. Each treatment group n = 5. All data represent the OD values mean + SEM based on n = 15 for all groups. Each sample was run in duplicate *p < 0.05 in comparison to the scrambled siRNAs or day 3 vs. day 10.
