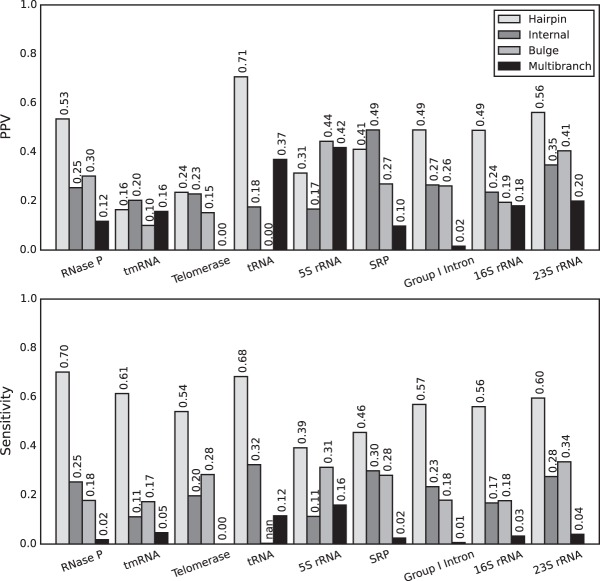
FIGURE 2.
Variation in the accuracy of the probability calculation by family of structured RNA. For each family, PPV (top) and sensitivity (bottom) are shown for loops with calculated probabilities >40%. The 40% threshold is chosen arbitrarily, and variation is similar at other thresholds (Supplemental Table S1).

