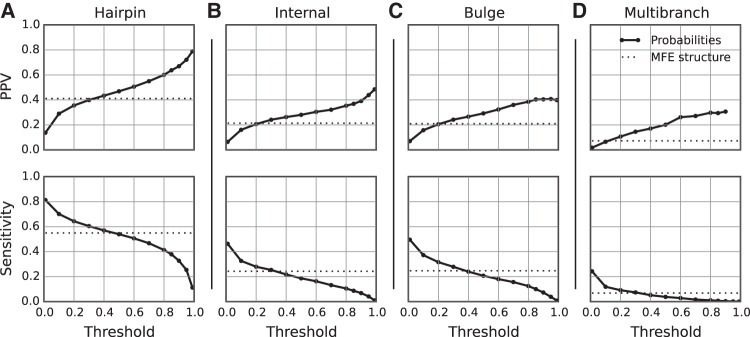
FIGURE 3.
Accuracy of loop probability estimation using stochastic sampling. The frequencies of hairpin loops (A), internal loops (B), bulge loops (C), and multibranch loops (D) found in 1000 structures provided probability estimates, and loops with probabilities greater than a specified threshold were compared to the known structure. Here, the PPV (top) and sensitivity (bottom) are plotted as a function of threshold value. The dotted line in each plot gives the PPV or sensitivity of a minimum free energy structure prediction.

