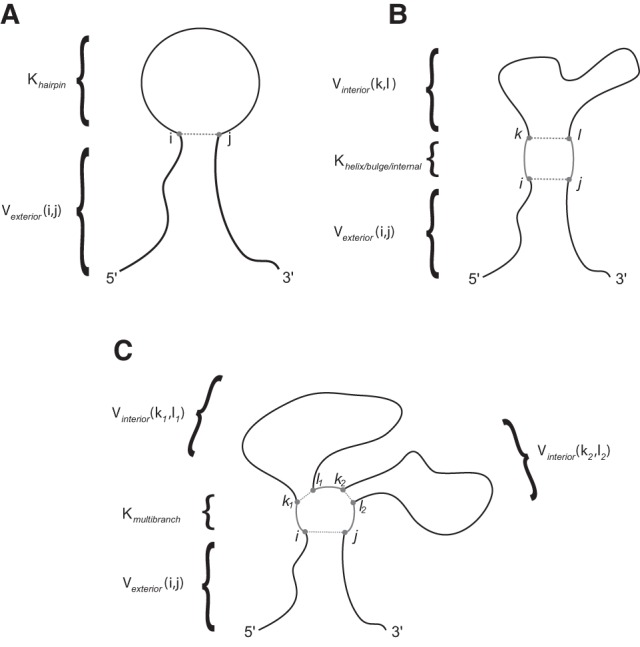
FIGURE 7.

A diagram depicting the loop probability calculation for (A) hairpin loops; (B) helices, bulges, and internal loops; and (C) multibranch loops. For the region of the RNA containing the loop or helix, shown in gray, the structure is known, and there is an equilibrium constant K for the region in the nearest neighbor parameters. For the regions with unknown structure, shown in black, the partition function for the region can be found in the V table from the partition function calculation. The known region is “frozen in place” while the rest of the structure varies, so all secondary structures containing the loop or helix are implicitly accounted for.
