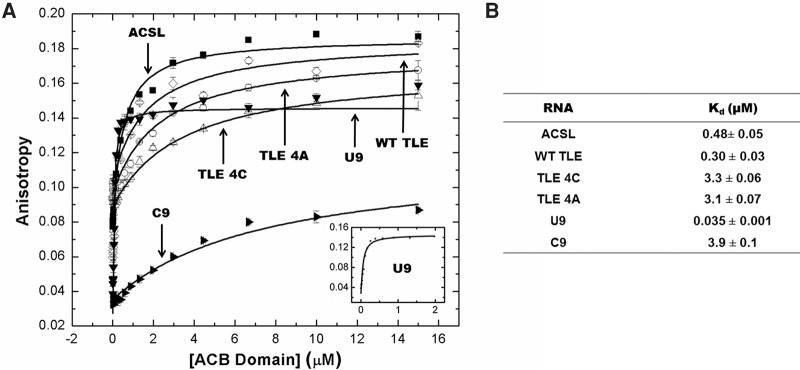
FIGURE 2.
FA binding assay results. RNAs were folded prior to FA measurements and binding was performed in 20 mM Tris–HCl, pH 8, 15 mM NaCl, 35 mM KCl, and 1 mM MgCl2, as described in Materials and Methods. (A) Binding of the ACB domain to various RNA oligonucleotides. The inset contains the binding curve of U9 with the concentration of the ACB domain up to only 2 µM to show the tight binding. (B) Table summarizing the apparent dissociation constants of the RNA oligonucleotides binding to the ACB domain measured by FA. The results are the average of two trials with the standard deviation indicated.

