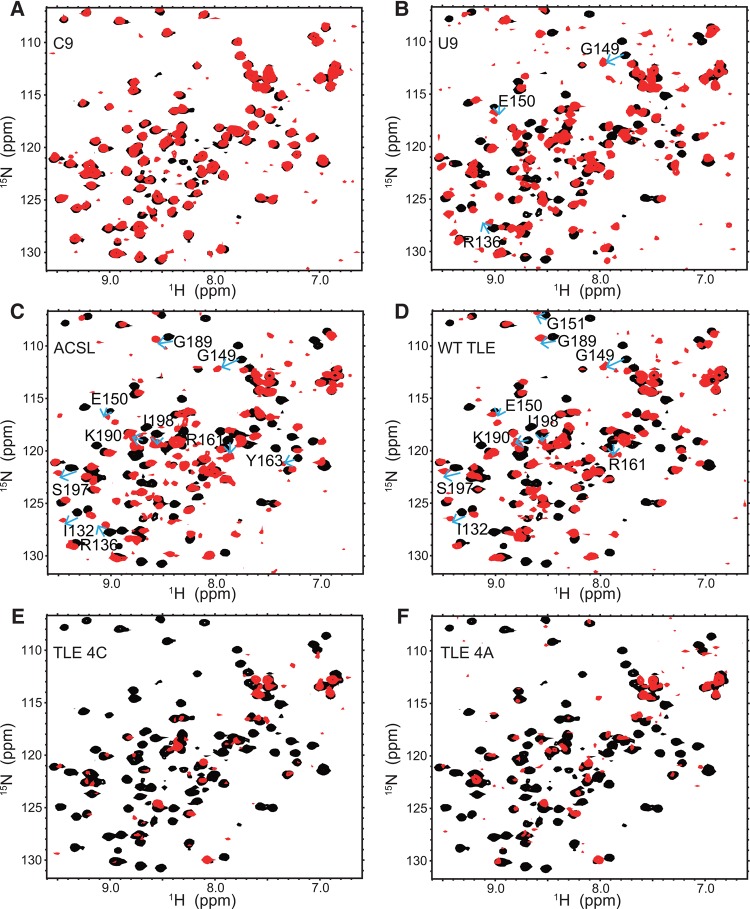
FIGURE 3.
(A–F) Overlays of HSQC spectra obtained for ACB alone (black) or ACB in the presence of C9, U9, ACSL, WT TLE, TLE 4C, and TLE 4A RNAs, respectively (red). These NMR spectra were collected using a Bruker DMX 500 spectrometer at 25°C. Protein concentration is 50 µM and all HSQC spectra with RNAs are at 1.2:1 RNA to protein ratio. In panels B, C, and D, blue arrows for the indicated ACB residues are shown to indicate the direction of shift and location of the slow exchange resonances observed in the titrations involving RNAs U9, ACSL, and WT TLE, respectively.

