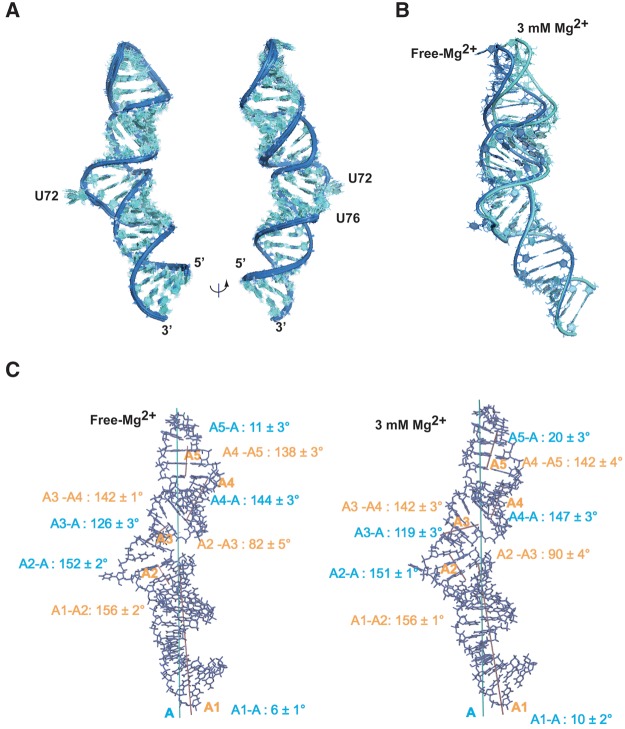
FIGURE 3.
Three-dimensional structure of HPI. (A) Superimposition of 10 converged NMR structures. Bases and sugars are shown in light blue and the backbone in dark blue. (B) Structures of HPI calculated using RDCs measured in the absence of Mg2+ (dark blue) and with 3 mM Mg2+ (light blue). The regions H1 are superimposed. (C) Inter-angle axis measurement for the free-Mg2+ structure (left) and 3 mM Mg2+ model (right). Overall axes (A) of RNAs are shown in blue. Five stems were defined using the 3DNA software (Colasanti et al. 2013). Helical axes for the five stems were generated using MOLMOL software and are indicated in pink (Koradi et al. 1996). Angles between each stem and the overall axis are indicated in blue. Angles between helices are indicated in orange.

