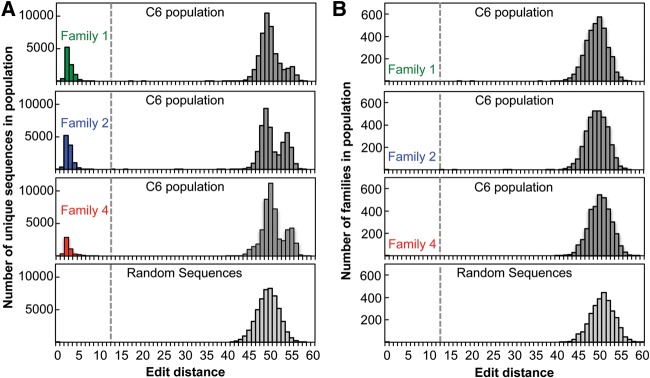
FIGURE 3.
Sequences can be clustered into families of closely related sequences. (A) The number of unique sequences within population C6 as a function of edit-distance from the most common sequence from each of families 1, 2, and 4. Sequences to the left of the dashed line are within the indicated family. The bottom panel shows the edit distance between an arbitrary sequence and a set of randomly generated sequences from a simulated population. (B) The number of independent sequence families as a function of edit-distance from the most common sequence from each of families 1, 2, and 4. Edit distances between families are calculated based on the edit distance between the most common sequence within the family. The bottom panel shows the edit distance between an arbitrary sequence and a set of randomly generated sequences from a simulated population.

