
FIGURE 4.
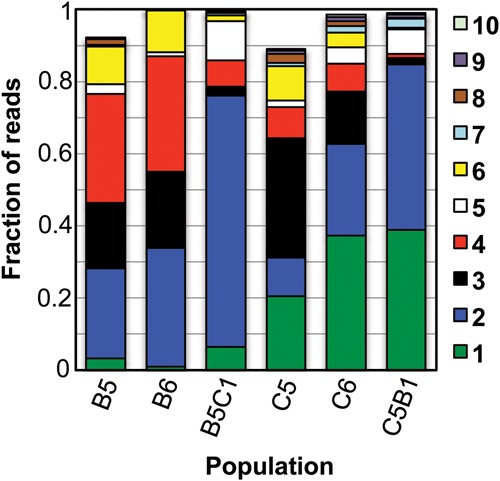
In all populations most of the reads can be clustered into a small number of shared families. The 10 families with the most reads in populations C6 are plotted as stacked bars for each population. For each population, the fraction of the populations’ reads that belong to these 10 families is shown. Each family is color-coded as indicated to the right of the graph. Families are numbered based on their abundance in the C6 population.