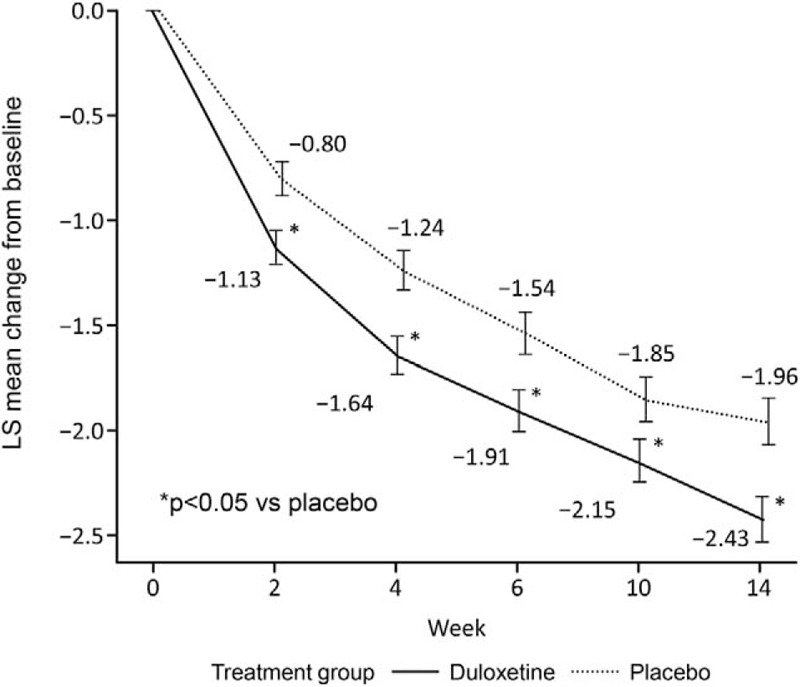
Figure 2.

Change in the Brief Pain Inventory average pain score in the full analysis set (MMRM analysis). Data are presented as adjusted mean ± standard error. LS indicates least squares; MMRM, mixed-effects model repeated measures.

Change in the Brief Pain Inventory average pain score in the full analysis set (MMRM analysis). Data are presented as adjusted mean ± standard error. LS indicates least squares; MMRM, mixed-effects model repeated measures.