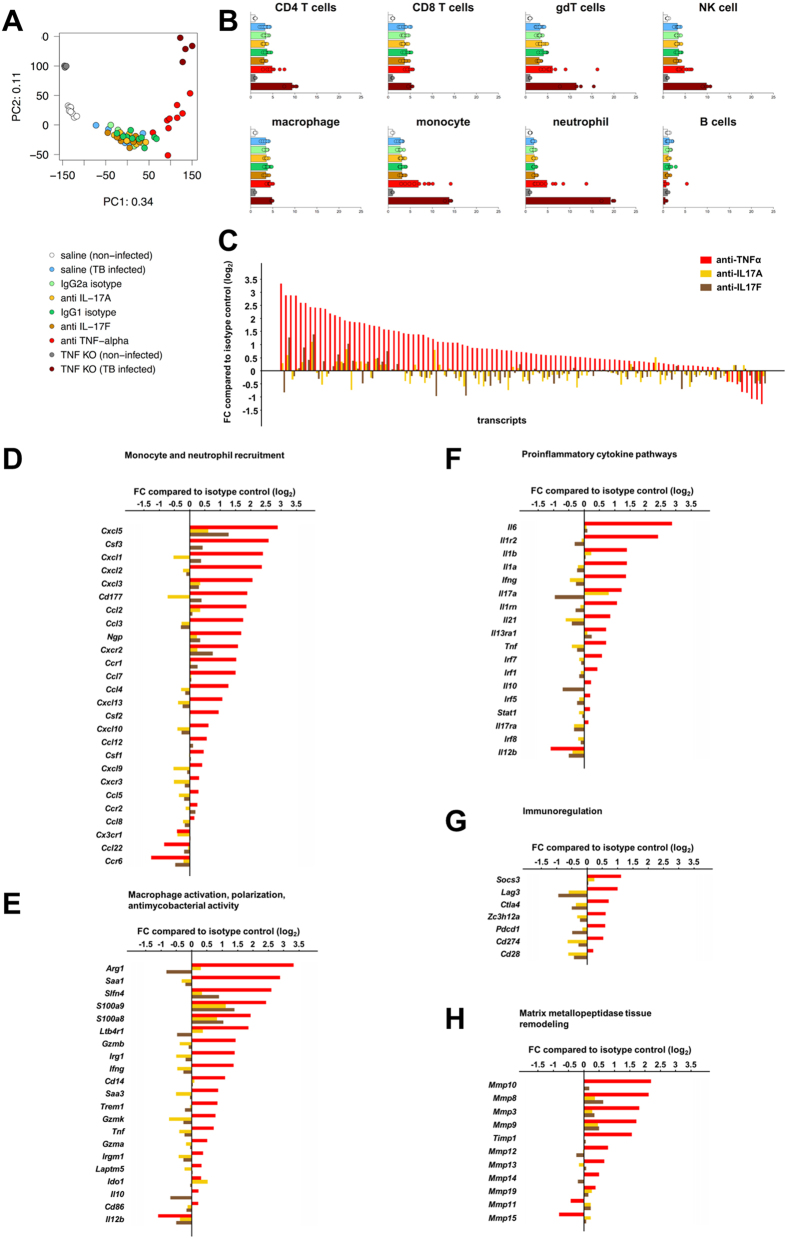
Figure 2. TNFα neutralization exacerbates gene expression of inflammatory markers in early phase of M. tuberculosis infection, in contrast to anti-IL-17A or anti-IL-17F treatment.
Transcriptional profiling of lungs from M. tuberculosis infected C57BL/6 mice (H37Rv, 1000 CFU i.n.) treated once per week (starting day-1) with anti-mouse IL-17A or IL-17F antibodies (20 mg/kg i.p.), anti-mouse TNFα antibody (10 mg/kg), respective isotype control antibodies, from non-infected C57BL/6 mice treated with vehicle, or from infected and non-infected TNFα-deficient mice, was performed on day 28 to assess molecular changes. (A) Principal component analysis plot of the gene expression data showing the first two principal components. Each dot represents an individual animal. (B) Bar plot graphs showing the geometric mean for the fold changes of all the genes in the manually-curated gene lists for CD4 T cells, CD8 T cells, γδT cells, NK cells, macrophages, monocytes, neutrophils and B cells. The fold change for M. tuberculosis infected vehicle, IgG2a isotype, anti-IL–17A, IgG1 isotype, anti-IL–17F and anti-TNFα treated groups was calculated relative to non-infected vehicle-treated animals, while the fold change for infected TNFα-deficient animals was calculated relative to non-infected TNFα-deficient animals. (C–H) Waterfall plots showing selected gene transcripts indicative of host-pathogen interactions, monocyte, macrophage and neutrophil recruitment, proinflammatory cytokine and chemokine pathways, TNFα pathway, matrix metallopeptidase tissue remodeling, macrophage activation, polarization and antimycobacterial activity, and immunoregulatory responses, in lung tissue of Mycobacterium tuberculosis-infected mice at day 28 following anti-TNFα, anti-IL-17A or anti-IL-17F treatment. A comprehensive overview of changes is provided in (C), while (D–H) represent functionally annotated gene lists. All results are expressed as log2-transformed fold changes (FC) in mRNA expression of anti-TNFα, anti-IL-17A or anti-IL17F treated infected mice over the respective IgG2a or IgG1 isotype controls. Transcripts are ranked by magnitude of FC in anti-TNFα treated animals. Boxplots for selected genes showing the MAS5 normalized expression level for each individual animal, the lower and upper quartiles and the median for the group, are depicted in Supplementary Fig. S4A–D.

