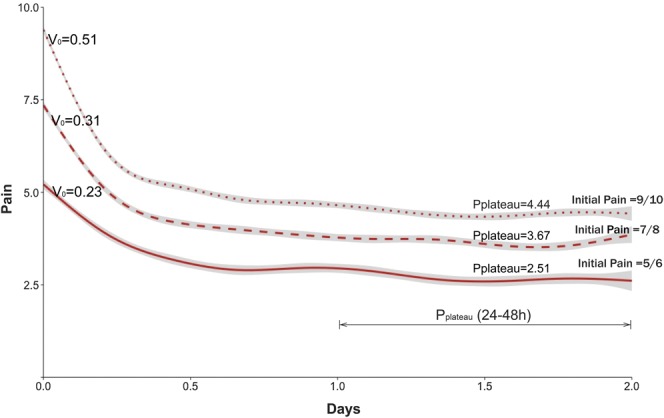
Figure 3.

Observed average pain trajectories for patients with 3 levels of initial pain (5 or 6, 7 or 8, and 9 or 10): Vo is the rate of decrease of pain score during the first 2 hours after initial pain recording and Pplateau is the average pain during the 24 hours (24-48 hours) of pain recording. X-axis (“Days”) denotes the time elapsed, in days, since the initial pain measurement. Y-axis (“Pain”) denotes the pain score.
