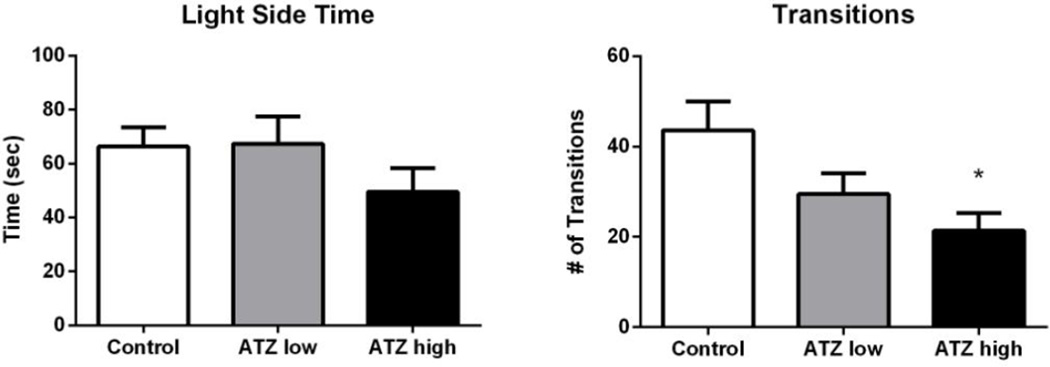
Figure 6.
The average duration of time spent in the light side of the chamber (left), and the average number of transitions between light and dark compartments (right). * indicates different from control group with p < 0.05. Means and SE were calculated as simple statistics. Analyses were performed using a mixed model ANOVA with t tests for planned comparisons.

