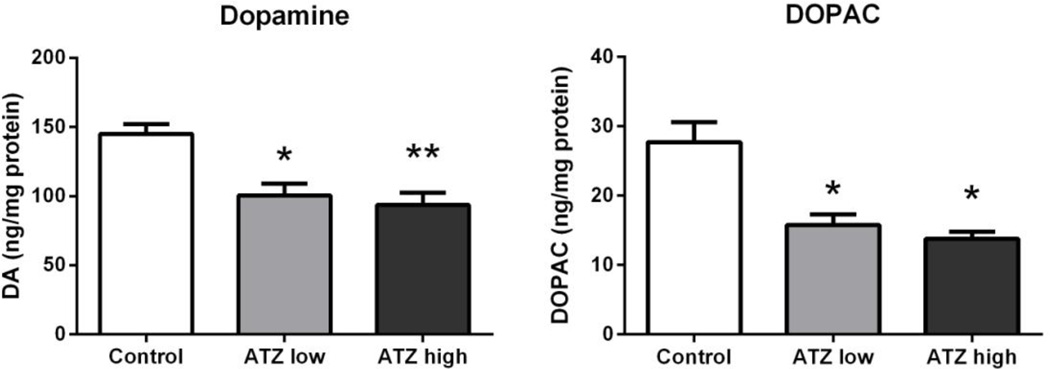
Figure 8.
Striatal dopamine (DA; left) and DOPAC (right) at 7 months of age. Means and SE presented were calculated as simple statistics. Analyses were performed using a mixed model ANOVA with t tests for planned comparisons. * indicates significantly different from control group with p < 0.05. ** indicates significantly different from control with p < 0.01.

