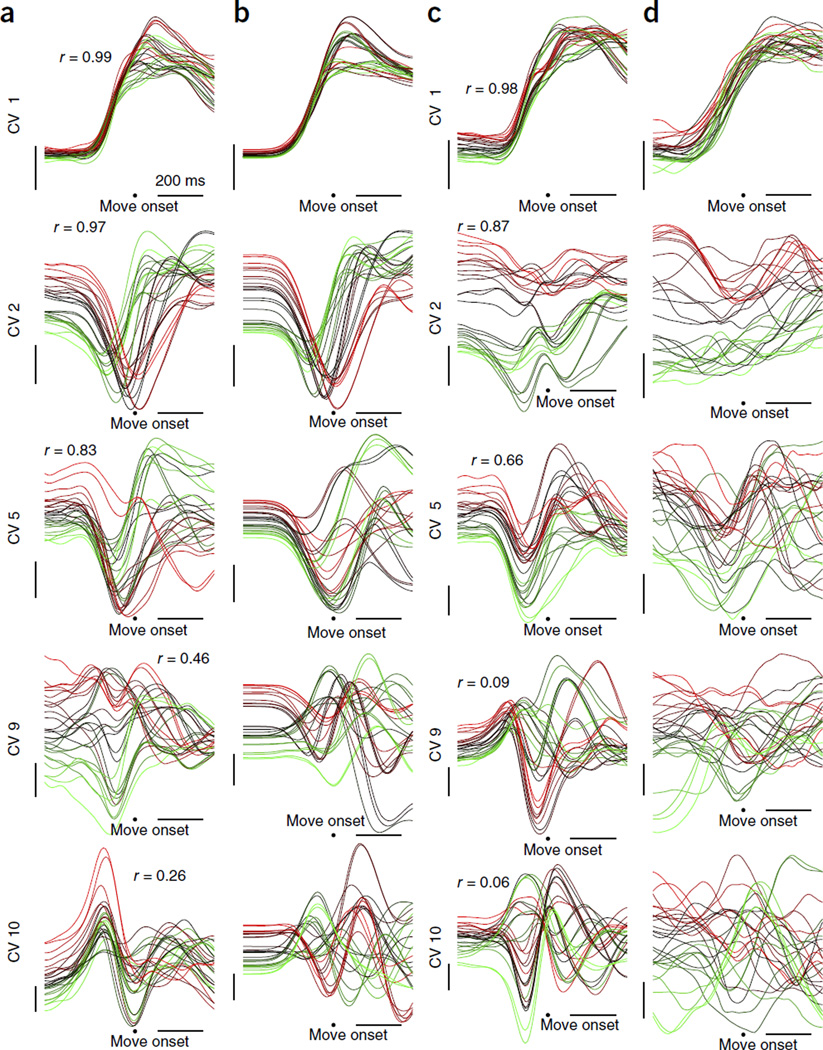
Figure 4.
Canonical correlations analysis for monkey J. (a,b) CCA projections (canonical variables) of the neural population response (a) and the regularized model for monkey J (b). These projections involve the directions in state-space that maximally correlate the neural data with the model data, resulting in a series of maximally to minimally correlated variables. Each row shows one of the canonical variables (CVs) 1, 2, 5, 9 and 10, highlighting the most and least similar projections. The correlation r is also shown. Traces are colored on the basis of the value of the projection at the beginning of the trace. The vertical scale bars indicate 1 arbitrary unit and the horizontal scale bars represent 200 ms. (c,d) Canonical variables of the neural population response (c) and the complicated model for monkey J (d) (data are presented as in a and b).

