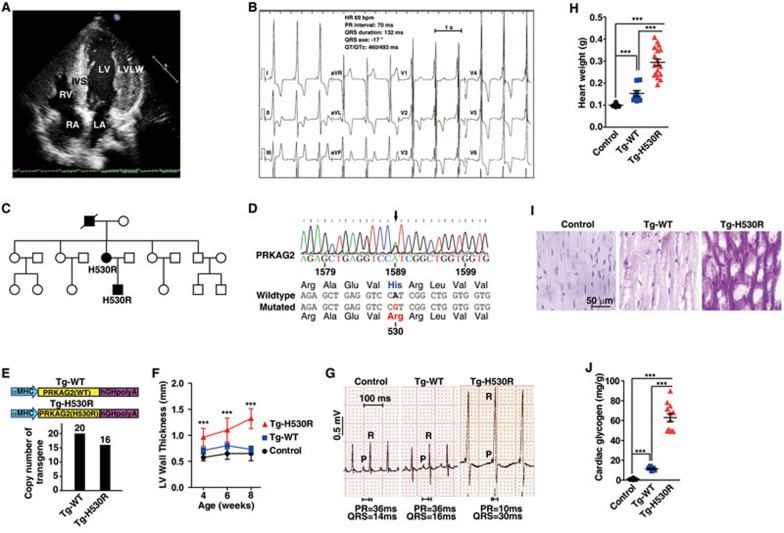
Figure 1.
A missense mutation H530R of PRKAG2 is identified from a family with WPW syndrome. (A) Echocardiogram of the patient (the son). IVS, interventricular septum (16 mm); LVLW, lateral wall of left ventricle (22 mm); LA, left atrium; RA, right atrium; LV, left ventricle; RV, right ventricle. (B) 12-lead electrocardiogram of the patient (the son) with the PRKAG2 cardiac syndrome. (C) Pedigree of the family with PRKAG2 cardiac syndrome. Circles indicate female family members, and squares indicate male family members. Solid symbols denote affected family members, and the symbol with a slash indicates deceased family member. (D) Sequencing of PRKAG2 cDNA of the patient (the son). The arrow points to c.1589A>G mutation of PRKAG2 cDNA, which leads to missense mutation of H530R. (E) Diagram showing the heart-specific transgene constructs of PRKAG2. The copy numbers of exogenous PRKAG2 transgene were determined by qPCR analysis of αMHC promoter. (F) LV wall thickness calculated by echocardiography. Data represent mean ± SD. Two-way ANOVA was performed for overall differences (n = 5, 5, and 7 for control, Tg-WT, and Tg-H530R mice, respectively). Unpaired two-tailed Student's t-test was performed to analyze difference between Tg-H530R and Tg-WT mice (***P < 0.001). (G) Lead II electrocardiogram of 12-week-old mice. (H) Quantification of heart weight from 8-week-old control, Tg-WT, and Tg-H530R mice. Data represent mean ± SD. One-way ANOVA was used to analyze overall differences between all groups (n = 11, 8, and 18 for control, Tg-WT, and Tg-H530R mice, respectively). Unpaired two-tailed Student's t-test was performed for single comparison (***P < 0.001). (I) PAS staining of paraffin-embedded sections. (J) Measurement of glycogen content in hearts from 8-week-old control, Tg-WT and Tg-H530R mice. The values are 1.023 ± 0.203, 11.45 ± 0.865, and 63.06 ± 3.99 mg/g, respectively. Data represent mean ± SD. One-way ANOVA was performed for overall differences (n = 8, 5, and 12 for control, Tg-WT, and Tg-H530R mice, respectively). Unpaired two-tailed Student's t-test was performed for single comparison (***P < 0.001).

