
Figure 5.
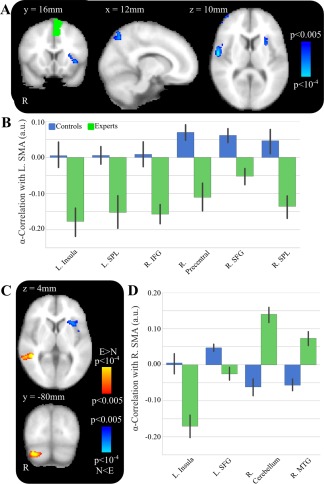
SMA α power correlations differences between experts and controls. A, Group‐level activations for L SMA α‐power correlations contrast for controls > experts. Multiple significant clusters are displayed including L insula. B, Post‐hoc tests show significant differences between the two groups, with experts having a significantly lower α‐connectivity to L SMA at multiple regions. C, Group‐level activations for R SMA α‐power correlations contrast for controls > experts (blue) and experts > controls (red). Multiple significant clusters are displayed including L insula and R middle temporal gyrus. D, Post‐hoc tests show significant differences between the two groups, with experts having a significantly lower α‐connectivity to R SMA in L insula and L superior frontal gyrus and significantly higher α‐connectivity in R cerebellum and R middle temporal gyrus. [Color figure can be viewed at http://wileyonlinelibrary.com]