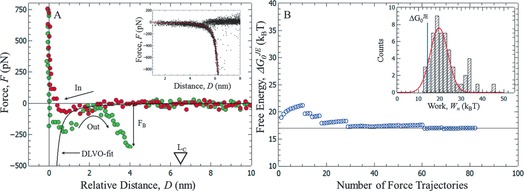
Figure 2.

A) Force–distance curve showing a single molecular rupture event of Dopa interacting with an NH2‐functionalized AFM tip at pH 4.2. The inset shows all detected single molecular rupture events aligned to the WLC model (red solid line). B) Convergence of the calculated interaction free energy using JE [Eq. (1)] for a particular loading rate. Inset: Distribution of measured work values.
