Figure 2.

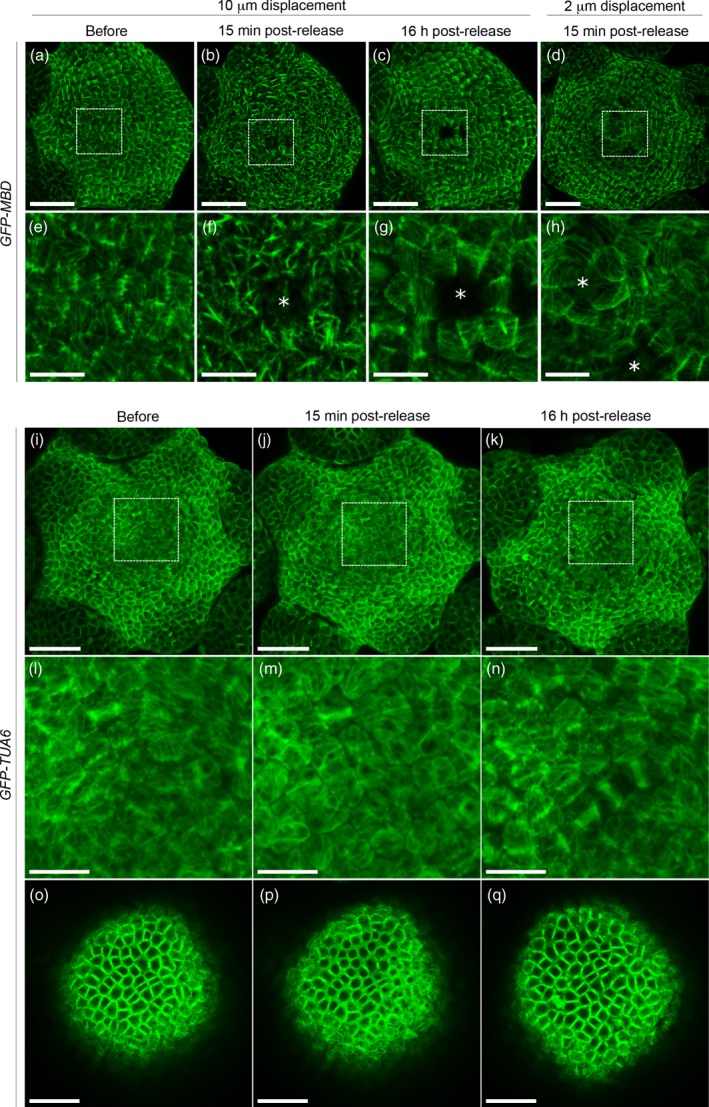
Microtubule response to compression in the GFP–MBD and GFP–TUA6 lines.
(a–h) Confocal images of GFP–MBD meristems projected in 2D. (a–c) Load value imposed during the 6 h 30 min compression corresponds to an initial displacement of 10 μm. (a) Before compression. (b) 15 min after release of compression. (c) 16 h after release of compression. (d) Load value imposed during the 6 h 30 min compression corresponds to an initial displacement of 2 μm. Image is taken 15 min after release of compression. (e–h) Close‐ups of (a–d) (white rectangle). White asterisks point at ablation sites. Scale bar = 30 μm in (a–d), and 10 μm in (e–h).
(i–n) Confocal images of GFP–TUA6 meristems projected in 2D. Load value imposed during the 6 h 30 min compression corresponds to an initial displacement of 10 μm. (i) before, (j) 15 min after and (k) 16 h after release of compression. (l–n) Close‐ups of (i–k) (white rectangles).
(o–q) One slice through the epidermis from (i–k), (o) before, (p) 15 min after and (q) 16 h after release of compression. Scale bar = 30 μm in (i–k), 10 μm in (l–n) and 20 μm in (o–q).
