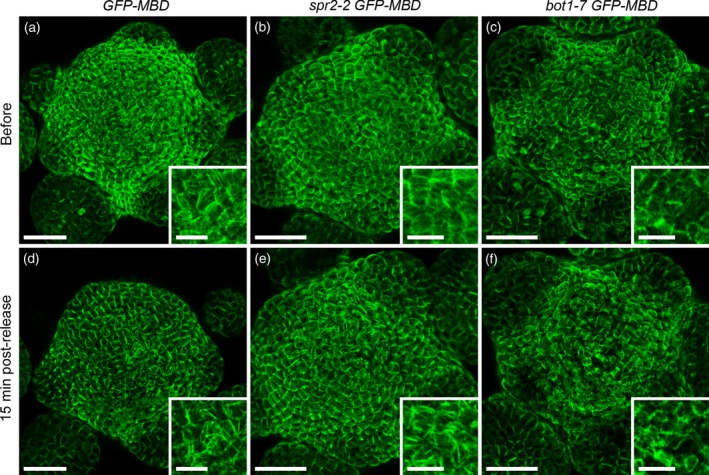
Figure 3.

Microtubule response to compression in spr2‐2 GFP–MBD and bot1‐7 GFP–MBD.
(a–f) Load value imposed during the 6 h 30 min compression corresponds to an initial displacement of 10 μm. Confocal images of dissected meristems projected in 2D from top and corresponding close‐ups taken (a–c) before compression and (d–f) 15 min after release of compression. (a, d) GFP–MBD microtubule marker line (control). (b, e) spr2‐2 GFP–MBD line. (c, f) bot1‐7 GFP–MBD line. Scale bar = 30 μm, and 10 μm in the close‐ups.
