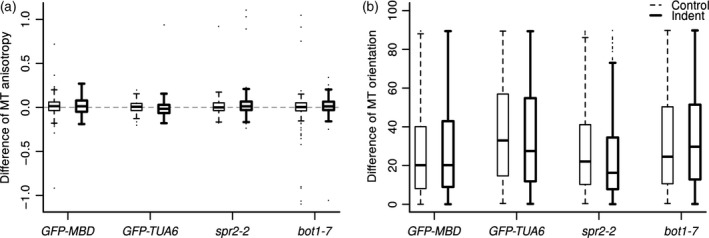
Figure 4.

Differences of anisotropy and orientation of microtubule arrays between time 6 h 45 min and time zero in two microtubule marker lines (GFP–MBD and GFP–TUA6) and in two mutants (spr2‐2 and bot1‐7).
(a) Differences of microtubule array anisotropy, as measured with the FibrilTool plugin.
(b) Differences of microtubule array orientation, as measured with the FibrilTool plugin. A mean direction of microtubules with the x‐axis is computed at time 6 h 45 min and compared to those of the snapshot at time zero. Differences are computed in degrees modulo 90. Dashed thin lines: control, i.e. non‐indented meristem. Continous thick lines: indented meristems.
