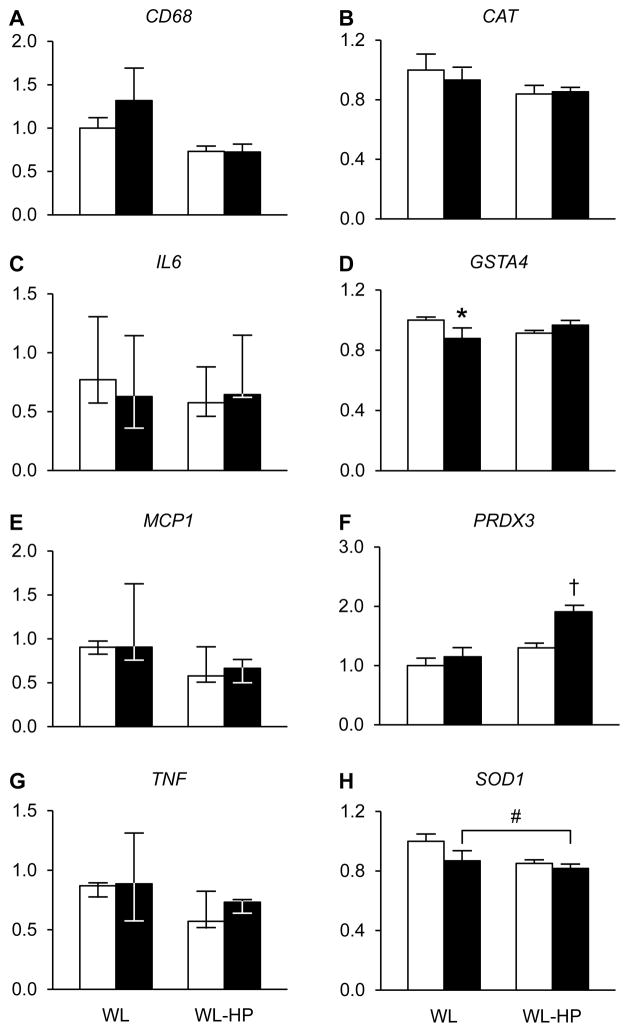
Figure 4. Expression of genes involved in inflammatory and oxidative stress defense pathways in muscle.
Expression of genes involved in inflammatory [A: cluster of differentiation 68 (CD68), C: interleukin-6 (IL6), E: monocyte chemoattractant protein 1 (MCP1), and G: tumor necrosis factor (TNF)]) and oxidative stress defense [B: catalase (CAT), D: glutathione S-transferase alpha 4 (GSTA4), F: peroxiredoxin 3 (PRDX3), and H: superoxide dismutase 1 (SOD1)] pathways before (white bars) and after (black bars) weight loss in subjects consuming the standard weight loss (WL) and weight loss high-protein (WL-HP) diets. Data (n = 6–9) are expressed relative to the housekeeping gene and presented as mean ± SEM, except for IL6, MCP1 and TNF, which are expressed as median (quartiles). * Value significantly different from corresponding basal value (P <0.05). † Value significantly different from all other values (P <0.05). # Significant main effect of weight loss (P <0.05). See also Table S3 and Figure S3.

