
Figure 3.
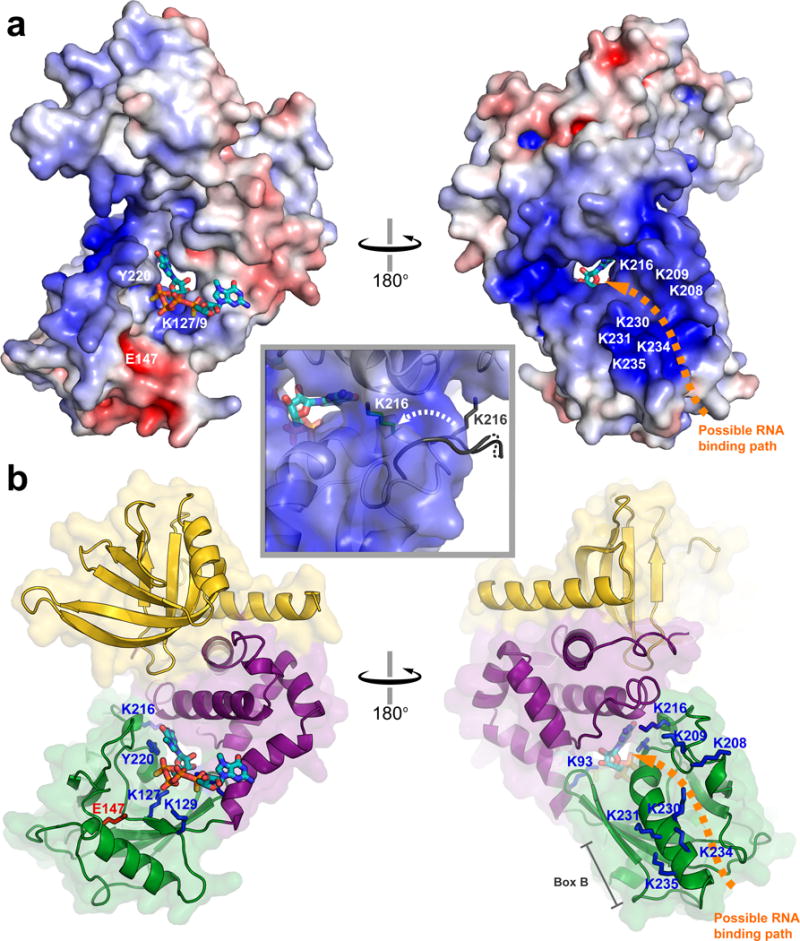
The cap-bound conformation of Dcp2 harbors a positively-charged tunnel that may bind RNA. (a) Electrostatic surface potential of the cap-bound conformation of Dcp1–Dcp2 (−7 to +7 kT/e; PNRC2 is not shown). The location of RNA binding residues are labeled in white, and an orange arrow shows a possible path for RNA binding through the tunnel to the cap binding site. The inset shows a close-up view of the positively charged tunnel, and the movement of K216 from a solvent-exposed flexible loop in the apo structure (gray) to a more structured conformation that points into the putative RNA binding tunnel in the cap-bound structure (green stick). (b) Cartoon views of the cap-bound Dcp1–Dcp2 structure oriented as in (a), Dcp1 is yellow, Dcp2 regulatory domain is purple, Dcp2 Nudix domain is green, residues important for RNA binding are highlighted as blue sticks, and the catalytic base E147 is shown in red.