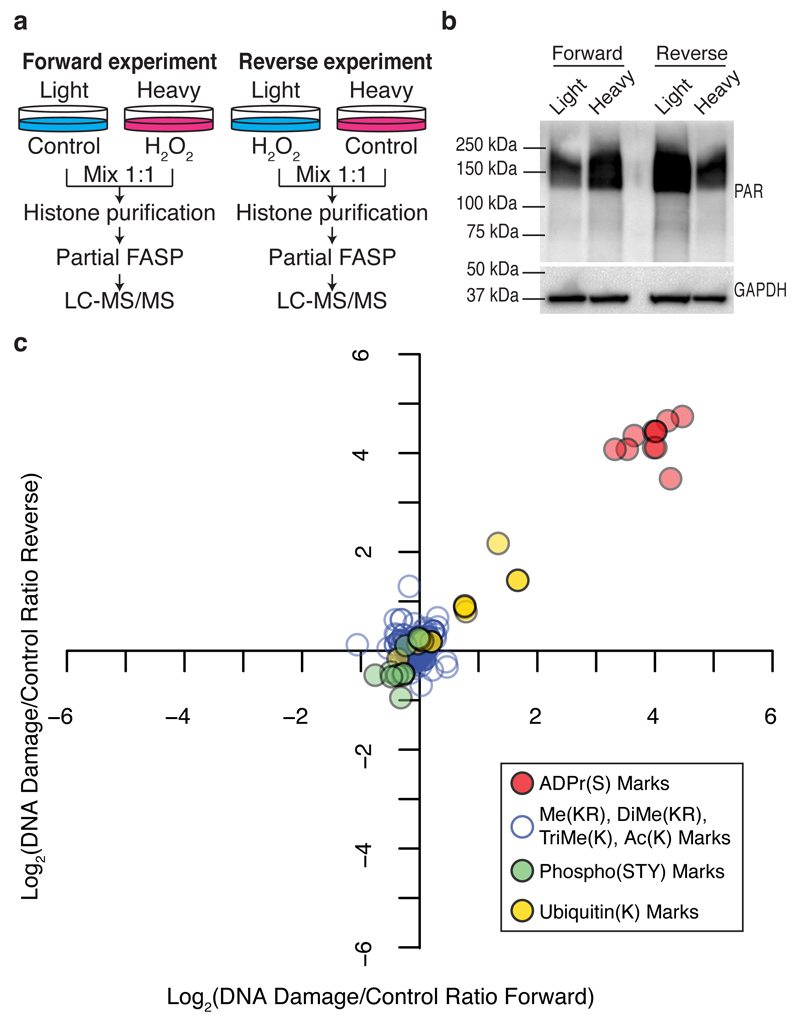
Figure 3. Modulation of serine ADP-ribosylation marks on core histones upon DNA damage.
(a) Schematic representation of the SILAC-based strategy to quantify core histone marks upon 10 minutes of 2 mM H2O2-induced DNA damage. (b) Western blot analysis of total protein poly-ADP-ribosylation levels prior to mixing light and heavy lysates from each SILAC experiment. Anti-GAPDH was used as a loading control. See Supplementary Fig. 10 for original images. (c) Log transformed Heavy/Light SILAC ratios from the forward and Light/Heavy SILAC ratios from the reverse experiment were plotted against each other. Each point represents a unique histone mark.

