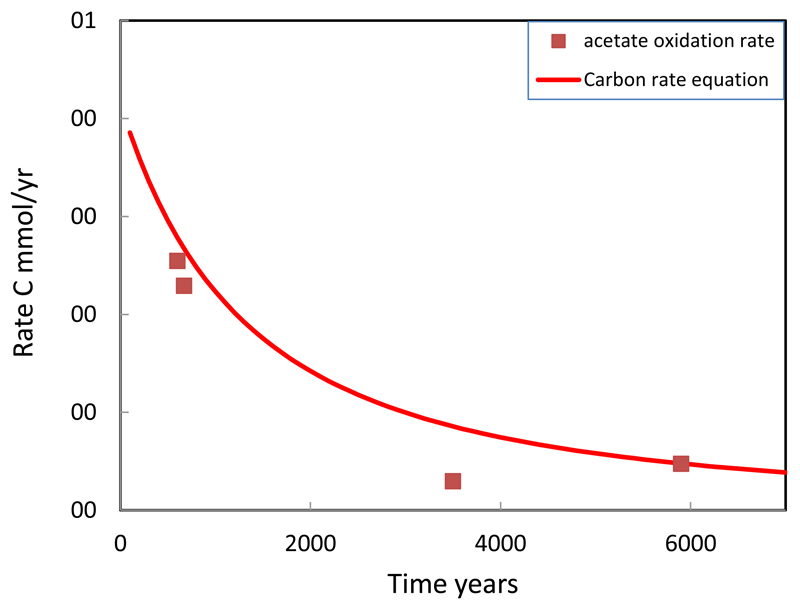
Fig. 7.
The rate of organic carbon degradation as a function of time. Symbols represent radiotracer acetate oxidation rate measurements on sediments whose burial age was dated by optical stimulated luminescence (Postma et al., 2012). The solid line is given by rate Eqn. (4) as incorporated in the model.

