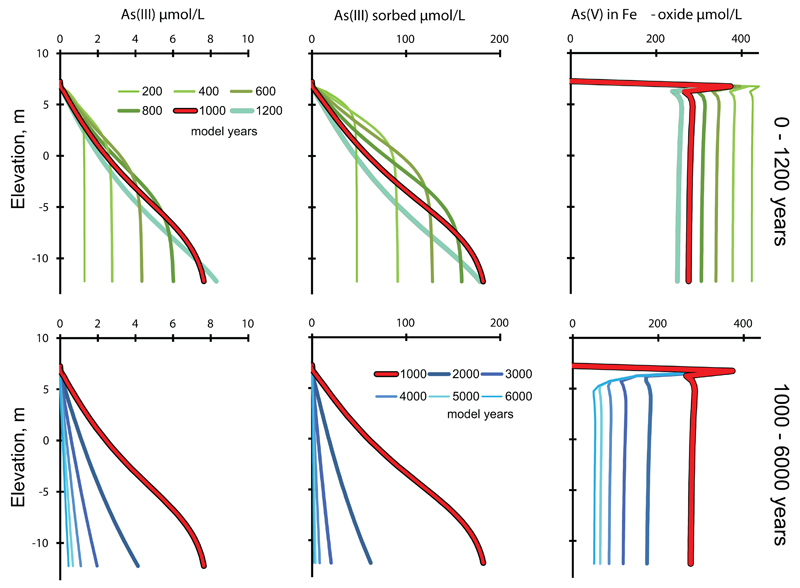
Fig. 9.
The turnover of arsenic between aqueous and sedimentary models pools. Upper row 200-1200 years in 200 yr steps, lower row 1000-6000 years in 1000 yr steps. The bold red line, indicating 1000 years, is the same in upper and lower panels. Solid phase concentrations have been recalculated to concentration per liter of contacting groundwater to enable comparison.

