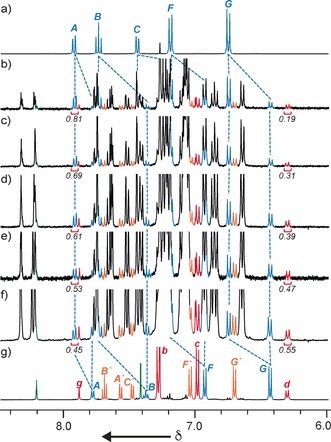
Figure 2.

Partial 1H NMR stack plot (400 MHz, 298 K, CDCl3) with selected signals assigned and integrated of a) macrocycle 1, g) heterocircuit rotaxane 15 c, and b)–f) the crude product mixtures after 1–5 rounds of AT‐CuAAC coupling, respectively. See Scheme 2 for labeling.
