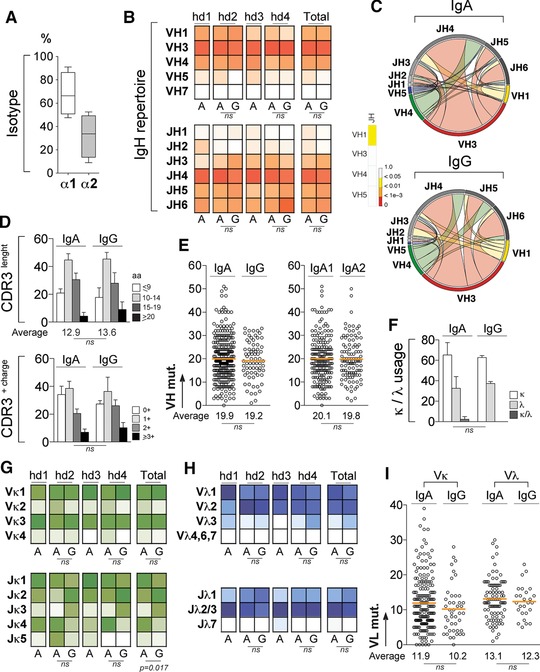
Figure 1.

Immunoglobulin gene repertoire of IgA+ memory B‐cell antibodies. Single CD19+CD27+IgA+ and CD19+CD27+IgG+ B cells from PBMCs of healthy donors were FACS sorted and their heavy‐ and light‐chain variable domains (IgH and IgL) amplified and sequenced. All immunoglobulin gene characteristics were determined by analyzing IgH and IgL sequences of 297 single IgA+ B cells isolated from four individuals (n = 58 for hd1, n = 56 for hd2, n = 84 for hd3, and n = 99 for hd4) and 70 single IgG+ B cells from two of them (n = 31 for hd2 and n = 39 for hd4) using IgBLAST; (http://www.ncbi.nlm.nih.gov/igblast) and IMGT® (http://www.imgt.org) online tools. (A) Box plot showing the frequency of IgA antibodies expressing IgA1 (α1) or IgA2 (α2) subclass as determined using Blast® alignment tool (NIH) and Fcα1 and Fcα2 gene sequences as reference (IMGT®). (B) Heat maps comparing the VH and JH gene usages between IgA+ and IgG+ memory B‐cell antibodies. Color gradient is proportional to the frequency for gene usages with darker colors indicating high frequencies while white corresponds to a frequency of 0. Groups were compared using 2 × 5 Fisher's Exact test. ns, not significant. (C) Circos plots generated from the immunoglobulin gene analysis using “circlize” (v0.3.1) R package compare the frequency of VH(DH)JH rearrangements between IgA+ and IgG+ memory B‐cell antibodies. Heat bar shows the results of the 2 × 5 Fisher's Exact test used to compare both groups. (D) Bar graphs comparing the CDRH3 aminoacid length and number of positive charges in the CDRH3 between IgA+ and IgG+ memory B‐cell antibodies. Groups were compared using 2 × 5 Fisher's Exact test. ns, not significant. (E) Comparison of the number of mutations in VH genes (VH mut.) between IgA+ and IgG+ memory B‐cell antibodies, and between IgA1 and IgA2 subclasses. The average number of mutations is indicated below each dot plot. Groups were compared using Student's t‐test with Welch's correction. ns, not significant. (F) Bar graphs comparing the frequency of Igκ− and/or Igλ−expressing antibodies between IgA+ and IgG+ memory B‐cell compartments. Groups were compared using 2 × 5 Fisher's Exact test. ns, not significant. (G) Same as in (B) but for Vκ and Jκ gene usages. (H) Same as in (B) but for Vλ and Jλ gene usages (I) Same as in (E) but for IgA Vκ and Vλ genes.
