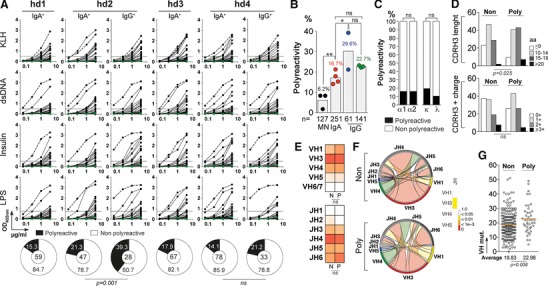
Figure 3.

Polyreactivity of IgA+ memory B‐cell antibodies. (A) The reactivity of recombinant IgA+ and IgG+ memory antibodies against KLH, dsDNA, insulin and LPS was measured by ELISA. In total, 251 recombinant IgA (from four healthy individuals; n = 59 for hd1, n = 47 for hd2, n = 67 for hd3, and n = 78 for hd4), and 61 IgG monoclonal antibodies (from hd2 and hd4 donors, n = 28 and n = 33, respectively) were tested and analyzed. Duplicate values were obtained from at least three independent experiments. Representative data from one experiment are shown as mean values. Dotted green and black lines represent the negative control antibody mGO53 8 and positive control antibody ED38 38, respectively. Horizontal lines show cut‐off OD405 nm for positive reactivity. Pie charts summarize the frequency of polyreactive (black) and non‐polyreactive (white) IgA+ and IgG+ memory B‐cell clones. The number of tested antibodies is indicated in the pie chart center. Groups were compared using 2 × 2 Fisher's Exact test. ns, not significant. (B) Bar graph comparing the frequency of polyreactive antibodies (as indicated above bars) between IgA+ memory B cells, and other B‐cell compartments: mature naïve B cells (MN) 8, IgG+ memory B cells from donor hd2‐hd4, and from historical data 15, 17. Each symbol represents a donor. Groups were compared using 2 × 5 Fisher's Exact test.* p < 0.05; ** p < 0.01; ns, nonsignificant. The number of antibodies tested in each group is indicated below each bar. (C) Bar graph comparing the frequency of polyreactive (black) and non‐polyreactive (white) IgA+ memory B cells according to IgA sub‐class (IgA1 or IgA2), and light chains used (Igκ or Igλ). Groups were compared using 2 × 5 Fisher's Exact test.ns, nonsignificant. (D) Bar graphs comparing the frequency of polyreactive and nonpolyreactive IgA+ memory B cells according to CDRH3 aminoacid length and number of positive charges in the CDRH3. Groups were compared using 2 × 5 Fisher's Exact test. ns, nonsignificant. (E) Heat maps comparing the frequency of VH and JH gene usages between polyreactive and nonpolyreactive IgA+ memory B cells. (F) Circos plots generated from the immunoglobulin gene analysis using “circlize” (v0.3.1) R package compare the frequency of VH(DH)JH rearrangements between polyreactive and nonpolyreactive IgA+ memory B cells. Heat bar shows the results of the 2 × 5 Fisher's Exact test used to compare both groups. (G) Dot plots comparing the number of mutations in VH genes between polyreactive and non‐polyreactive IgA+ memory B cells. Groups were compared using Student's t‐test with Welch's correction. ns, not significant.
