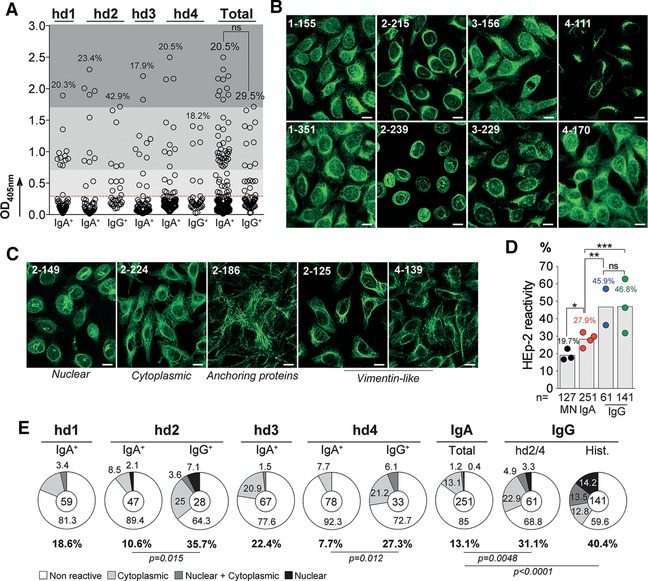
Figure 4.

Self‐reactivity of IgA+ memory B‐cell antibodies. The reactivity of the recombinant IgA+ and IgG+ memory antibodies against HEp‐2 cell antigens was evaluated by ELISA and indirect immunofluorescence assay (IFA). In total, 251 recombinant IgA (from four healthy individuals; n = 59 for hd1, n = 47 for hd2, n = 67 for hd3, and n = 78 for hd4), and 61 IgG monoclonal antibodies (from hd2 and hd4 donors, n = 28 and n = 33, respectively) were tested and analyzed. (A) Dot plots comparing the frequency of HEp‐2 reactive antibodies by ELISA (as indicated above dots) between IgA+ and IgG+ memory B cells. The data shown correspond to the mean values of triplicate obtained in two independent experiments. (B) and (C) show representative HEp‐2 cell IFA staining patterns of antibodies cloned from IgA+ (B), and IgG+ (C) memory B cells, respectively, tested in two experiments (Magnification ×40). White scale bar indicates 12 μm. (D) Bar graph comparing the frequency of combined ELISA/IFA HEp‐2 reactive antibodies (as indicated above bars) between IgA+ memory B cells, and other B‐cell compartments: mature naïve B cells (MN) 8, IgG+ memory B cells from donor hd2‐hd4 (blue dots), and from historical data (green dots) 15, 17. Each symbol represents a donor. Groups were compared using 2 × 5 Fisher's Exact test.* p < 0.05; ** p < 0.01; *** p < 0.001; ns, nonsignificant. The number of antibodies tested in each group is indicated below each bar. (E) Pie charts comparing the frequency (as indicated below and on charts) of non HEp‐2 reactive (white) and HEp‐2 reactive IgA+ and IgG+ memory B‐cell antibodies according to the different IFA reactivity patterns observed: cytoplasmic (light grey), nuclear plus cytoplamic (dark gray), and nuclear (dark). The number of tested antibodies is indicated in the pie chart center. Groups were compared using 2 × 5 Fisher's Exact test.
