Figure 3.

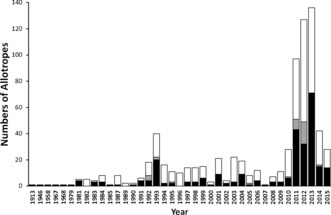
Distribution of new carbon allotropes proposed over the years (in black) and the repetitions (in white). The grey areas are repetitions of structures published in the same year. Note the interrupted time scale before 1989.

Distribution of new carbon allotropes proposed over the years (in black) and the repetitions (in white). The grey areas are repetitions of structures published in the same year. Note the interrupted time scale before 1989.