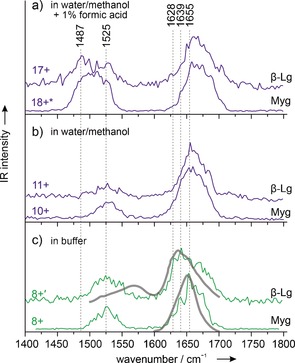
Figure 3.

Infrared spectra for gas‐phase and condensed‐phase myoglobin and β‐lactoglobulin. a, b)Spectra for ions sprayed from water/methanol solutions. The positions and shapes of the amide‐I bands around 1655 cm−1 indicate helical secondary structures. c) Spectra for samples sprayed from aqueous solutions (green lines) and solution phase FTIR spectra (gray lines; data reproduced from Ref. 18 for β‐lactoglobulin and Ref. 19 for myoglobin). The amide‐I band for myoglobin 8+ indicates a helical secondary structure, while that of β‐lactoglobulin shows a clear β‐sheet signature.
