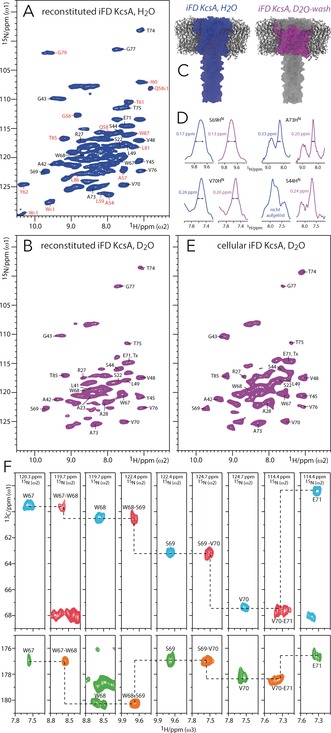
Figure 2.

1H detection of water‐inaccessible regions in the ion channel KcsA. All data were recorded at 60 kHz MAS and 800 MHz. 2D NH spectra of reconstituted iFD KcsA A) before (blue) and B) after a D2O wash (magenta), and of E) cellular D2O‐incubated iFD KcsA, measured in native cell membranes (magenta). Assignments in red and black were obtained with FD KcsA2f and iFD KcsA, respectively. C) Color coding of regions that feature detectable HN. All HN are present in iFD KcsA whereas only the TM ones remain after the D2O wash. D) t1 cross‐sections extracted from 2D NH spectra of iFD KcsA before (blue) and after (magenta) a D2O wash. F) 1H‐detected assignments of residues W67–E71 of the pore helix. Strip plots are shown for 3D CαNH (cyan), Cα(CO)NH (red), CONH (orange), and CO(Cα)NH (green) experiments.
