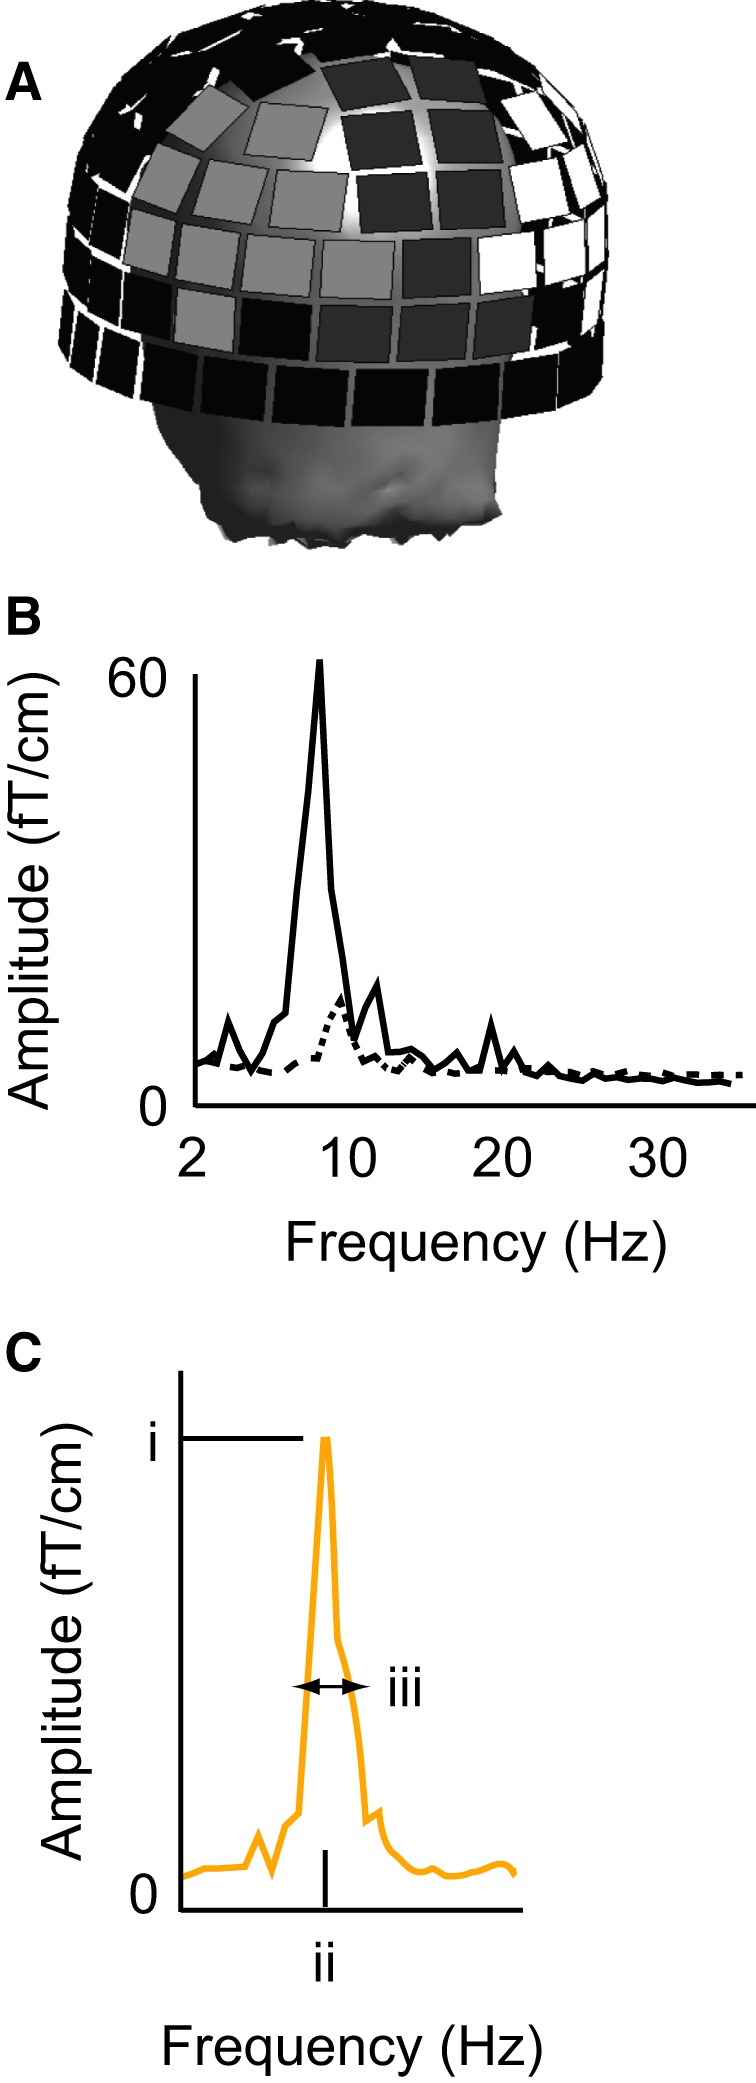
Figure 1.

MEG signals. (A) Difference spectra between eyes‐closed and eyes‐open conditions were measured at the maximum channels over three sensor regions (marked with light gray, dark gray and white over the helmet). (B) Example responses from one subject at a representative channel in the eyes‐closed (solid line) and eyes‐open (dotted line) conditions. (C) Vector sum of each channel pair was used for estimating (i) the amplitude of the ~ 10‐Hz spectral peak, (ii) the exact frequency at which the maximum amplitude was reached, and (iii) the spectral width (difference between the 50% point of the ascending and descending slopes).
