FIGURE 1.
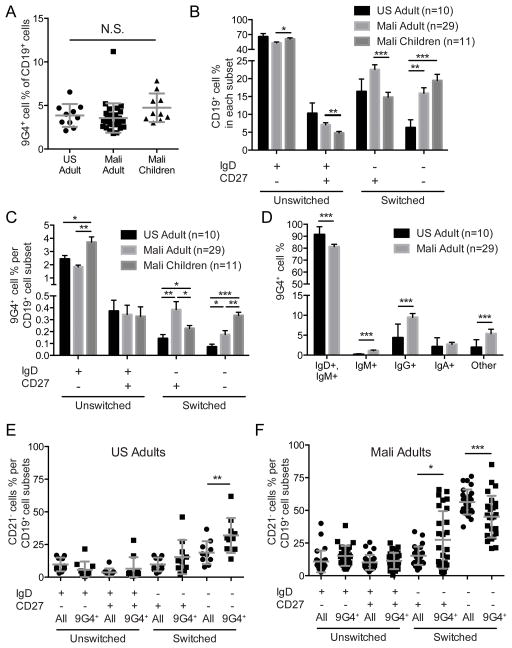
Characterization of 9G4+ B cells in the peripheral blood of US adults and Malian adults and children. (A) Percent of CD19+ B cells that are 9G4+ in the PBMCs of U.S. adults and Malian adults and six year old children. Mean and standard deviation (SD) are shown. (B) Percent of all CD19+ B cells that are naïve (IgD+, CD27−), unswitched CD27+ (IgD+, CD27+), classical switched MBCs (IgD−, CD27+), or switched, CD27− B cells (IgD−, CD27−). Mean and standard error of the mean (SEM) are shown. (C) Percent of B cells in each subset shown in B that are9G4+. Mean and SEM are shown. (D) Percent of 9G4+ B cells that stained using anti-IgM, anti-IgD, anti-IgG or anti-IgA or were not stained by these reagents (Other). Mean and SEM are shown. (E–F) Percent of all CD19+ B cell in each subset (All) or percent of 9G4+ B cell in each subset (9G4+) that were CD21− for U.S. adults (E) and Malian adults (F). Mean and SD are shown. Statistical comparisons were by Student’s T-test (* = p-value < 0.05; ** = p-value < 0.005; *** = p-value < 0.0005).

