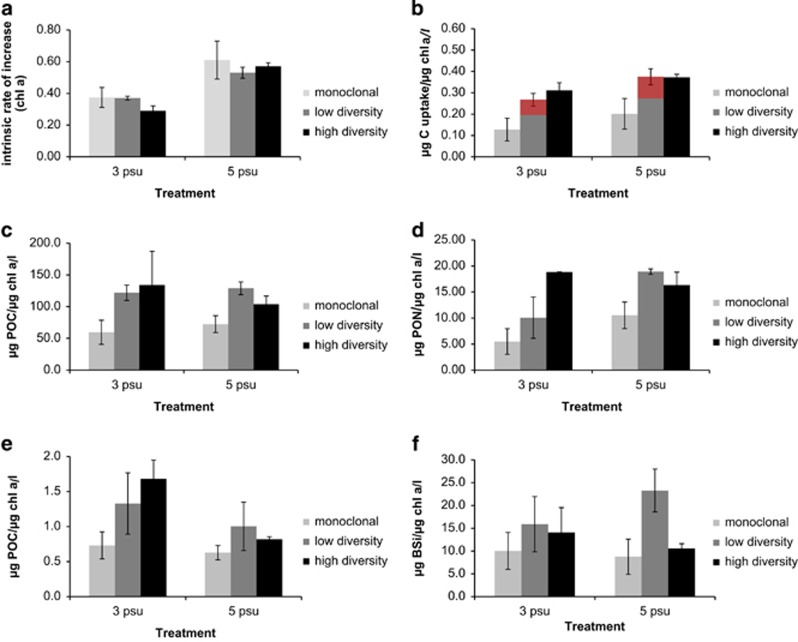
Figure 2.
Ecological performance of monoclonal cultures, a mix of five strains (low diversity) and a mix of (initially) 20 strains (high diversity) in 3 and 5 psu. (a) Intrinsic rate of increase based on chl a. (b) Carbon uptake. Red area represents overyield compared with the average of the monocultures. (c) POC. (d) PON. (e) POP. (f) BSi. (b–f) Normalized by chl a. See Table 2 for significant effects of diversity and salinity.

