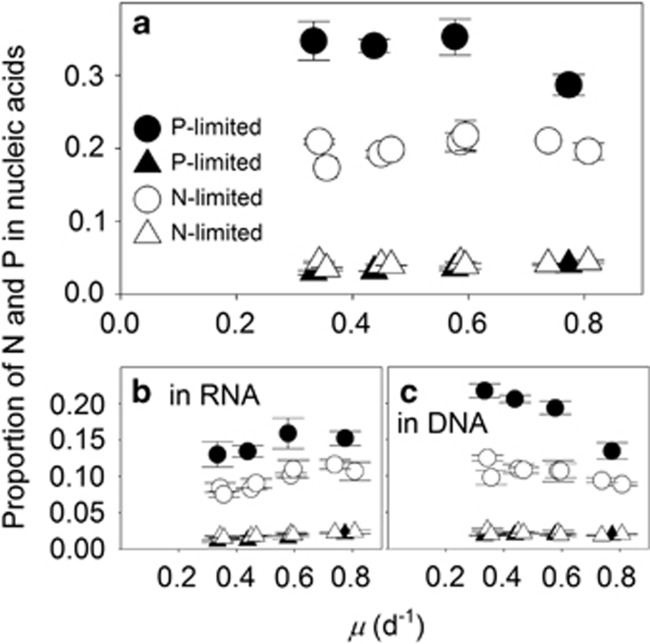
Figure 3.
Proportion of cellular N and P quotas devoted to nucleic acids. Cellular N (triangles) and P (circles) in total cellular nucleic acids (a), cellular RNA (b) and cellular DNA (c) as a proportion of total cellular N and P, respectively, as a function of steady-state growth (μ) in chemostat cultures of Synechococcus limited by nitrate (open symbols) or phosphate (closed symbols). Open symbols represent data from two independent, N-limited culture trials. Standard deviations are plotted on means of triplicate measurements from the last three sampling time points during a trial.

