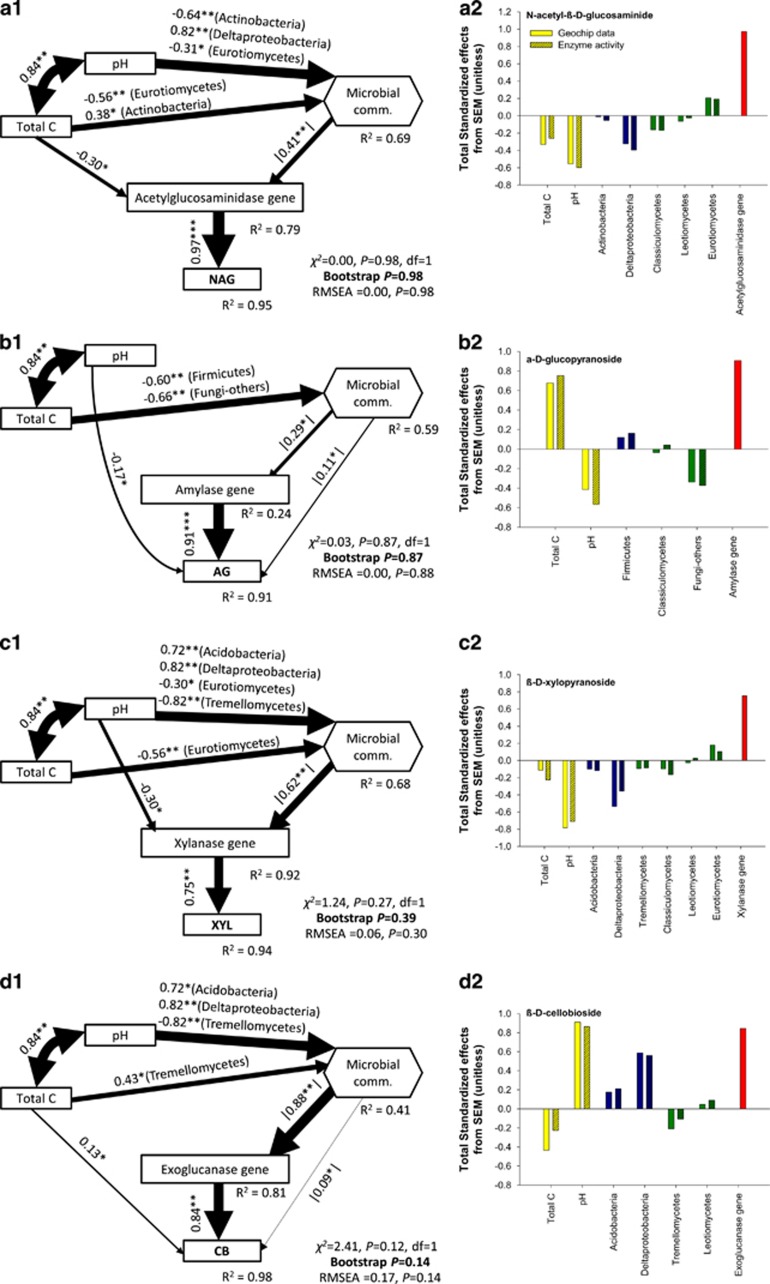
Figure 3.
Structural equation models based on the effects of soil properties (total C and pH), bacterial and fungal relative abundances and Geochip data on enzyme activities. Numbers adjacent to arrows are standardized path coefficients, analogous to partial regression weights and indicative of the effect size of the relationship (panels a1–d1). The sign of the the microbial community composition (microbial comm.) composite is not interpretable; thus absolute values are presented. Arrow width is proportional to the strength of path coefficients. As in other linear models, R2 indicates the proportion of variance explained and appears above every response variable in the model. Model fitness details (χ2 vs RMSEA and non-parametric Bootstrap parameters are close by each figure) are close to each figure. Significance levels are as follows: *P<0.05 and **P<0.01. Panels (a2–d2) represent standardized total effects (direct plus indirect effects) derived from the structural equation model used.

