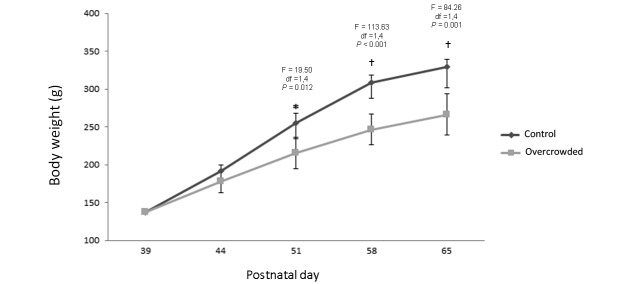
Figure 3.
Body weight of male juvenile Wistar rats on postnatal day (PND) 38 (before overcrowding); PND 44, 51, and 58 (during overcrowding); and PND 65 (after overcrowding). Gray line corresponds to the control group (n = 9); the green line corresponds to the overcrowded group (n = 9). For analysis of body weight, 2-way nested mixed-design ANOVA was used; *, P < 0.05; †, P < 0.01. Error bars indicate 1 SD. Posthoc univariate ANOVA were used to determinate specific group differences at each time point.

