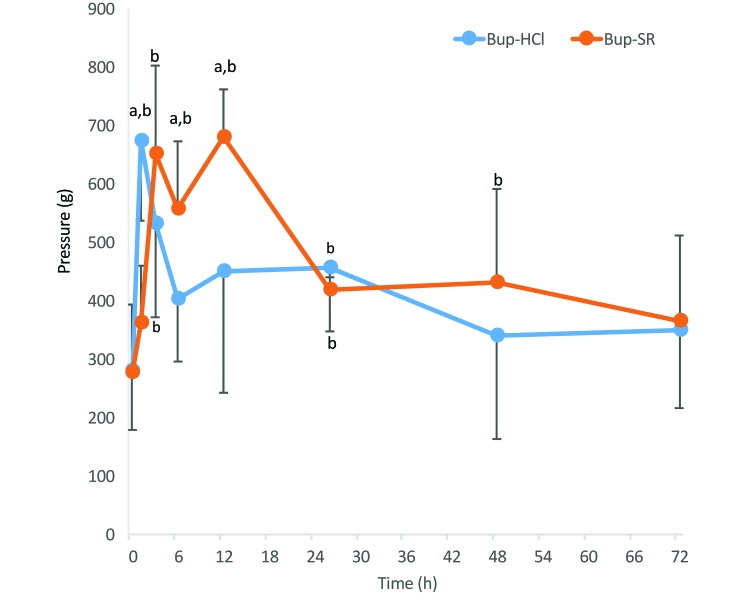
Figure 4.
Amount of pressure (mean ± 1 SD [error bars]) applied to the left hindpaw to measure the withdrawal response of guinea pigs treated with either Bup-HCl or Bup-SR. Six guinea pigs were sampled at each time point. a, significant (P < 0.09) difference between treatment groups; b, significant (P < 0.07) difference compared with baseline value within the group.

