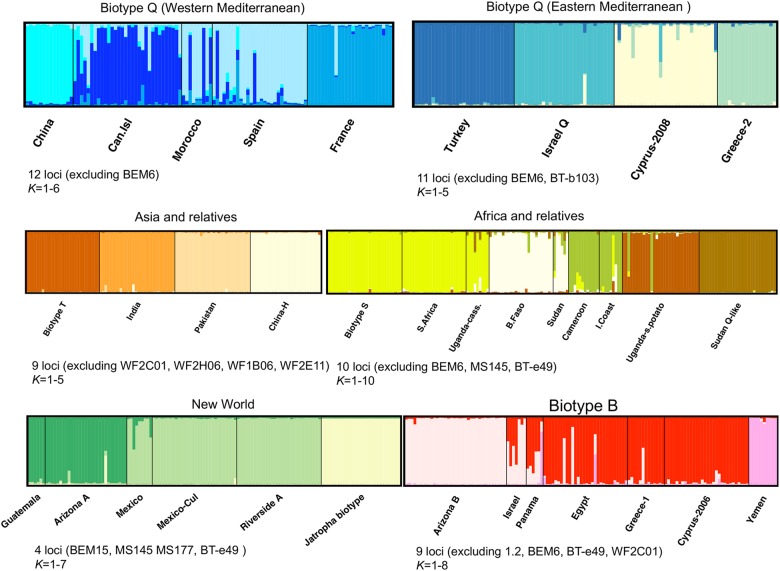
Fig 6. Bayesian clustering analysis results of multilocus genotypes of B. tabaci from different biotypes or geographic groups performed in Structure (sub-structure analysis).
Individuals are arranged on the x-axis, each represented by a thin vertical line and partitioned into each of the inferred clusters (K) with their estimated membership fractions on the y-axis. Labels below the plot represent the sampled populations and above the plot the biotypes or geographic groups. The number of K specified and the loci used in each run are indicated below each plot.

