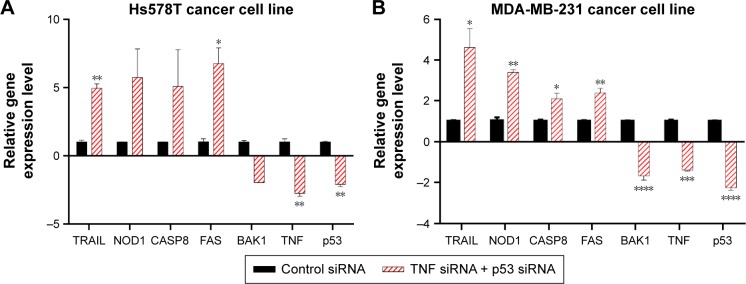
Figure 3.
mRNA gene expression levels evaluated through TaqMan assay after siRNA mut-p53 and siRNA TNF gene knockdown.
Notes: Two human triple-negative breast cancer cell lines (A) Hs578T and (B) MDA-MB-231. The experiment was performed in three biological replicates. Data were normalized using two reference genes, 18S and GAPDH. Data are shown as mean ± SEM, P-value is represented as *P≤0.05, **P≤0.01, ***P≤0.001, ****P≤0.0001.
Abbreviations: mRNA, messenger RNA; SEM, standard error of mean; siRNA, small interfering RNA; TNF, tumor necrosis factor.

